





Energy costs in block production silently erode profit margins. A 10,000-block daily operation consuming 800-1,200 kWh spends $35,000-65,000 annually on electricity alone—yet most producers track cement costs obsessively while ignoring 12-18% of operating expenses disappearing into motor inefficiencies and poor scheduling. Understanding energy consumption patterns and implementing targeted optimizations reduces costs by 25-40% without sacrificing output.
Research shows electrical energy represents 37% of total energy costs in cement and concrete manufacturing. With global concrete block demand reaching 4.7 billion tonnes in 2022 and production concentrated in energy-intensive operations, small efficiency gains compound into substantial savings. This guide breaks down consumption patterns, cost structures, and proven optimization methods drawn from actual production data.
Understanding Block Machine Energy Consumption
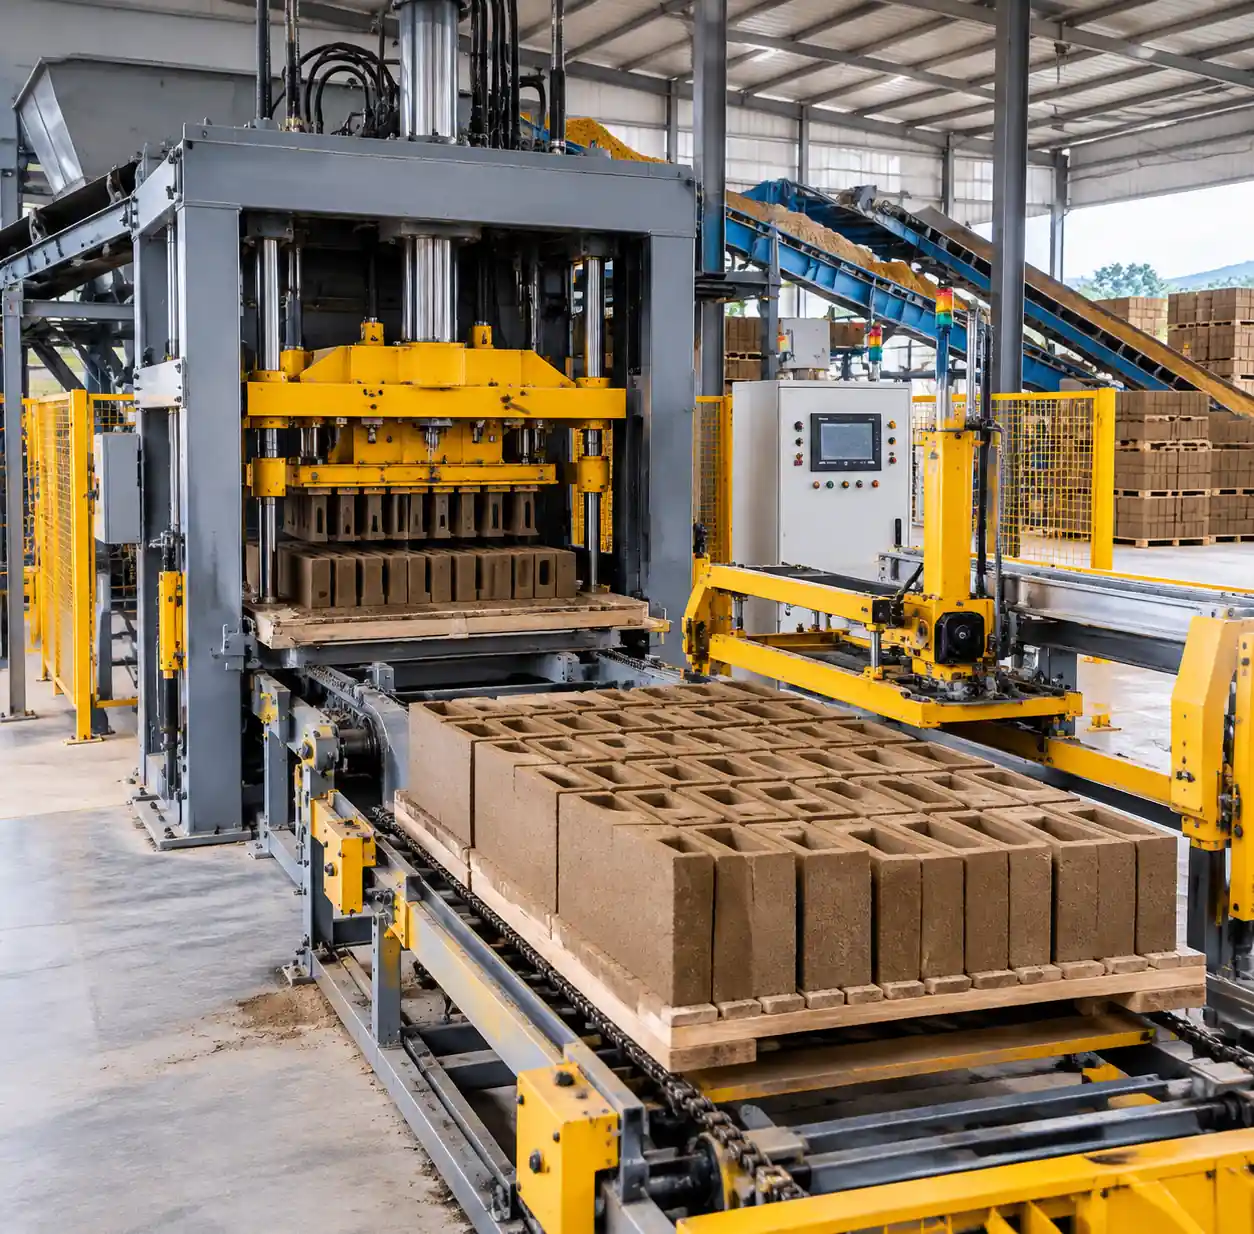
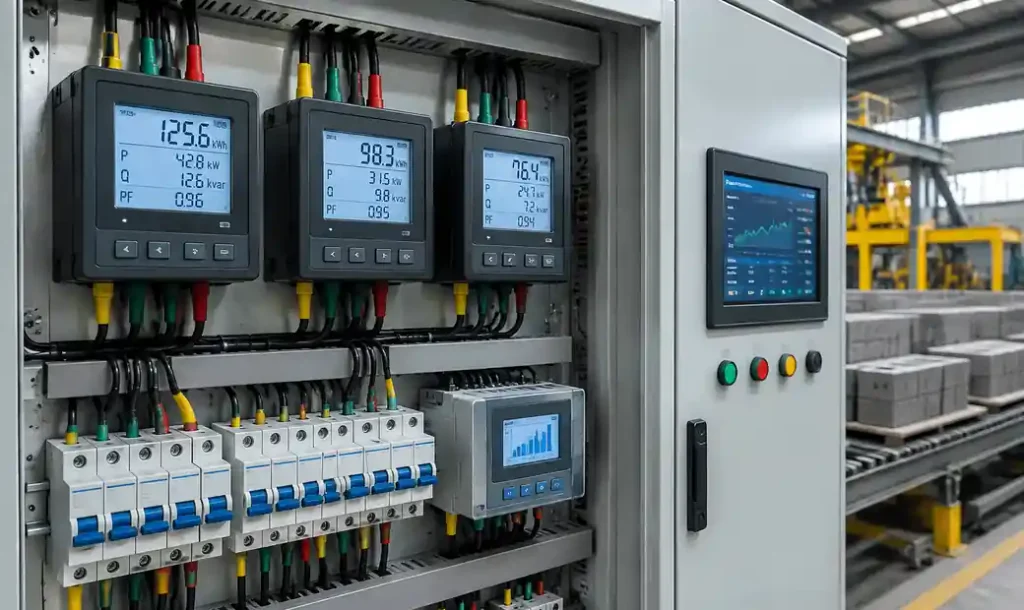
Block machines consume energy through multiple systems operating simultaneously: hydraulic power units generating compression force, vibration motors ensuring proper compaction, material handling equipment moving aggregates and finished blocks, plus supporting systems like batching controls and curing room environmental management.
Power Consumption by Machine Type
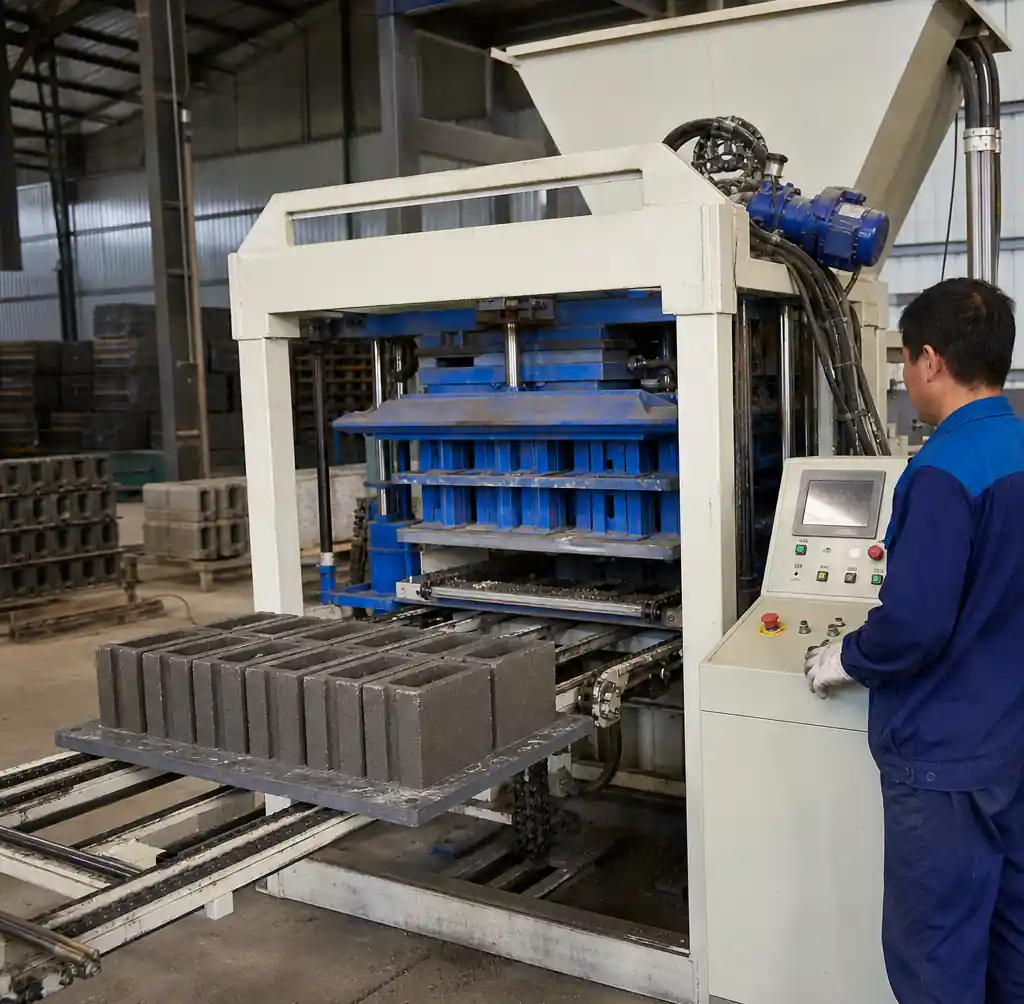
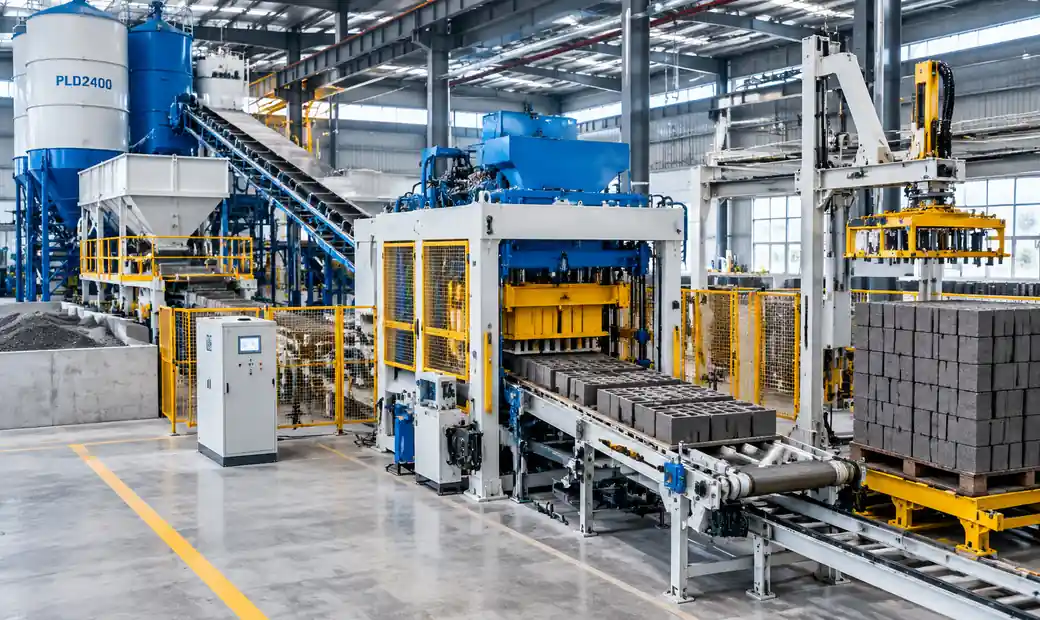
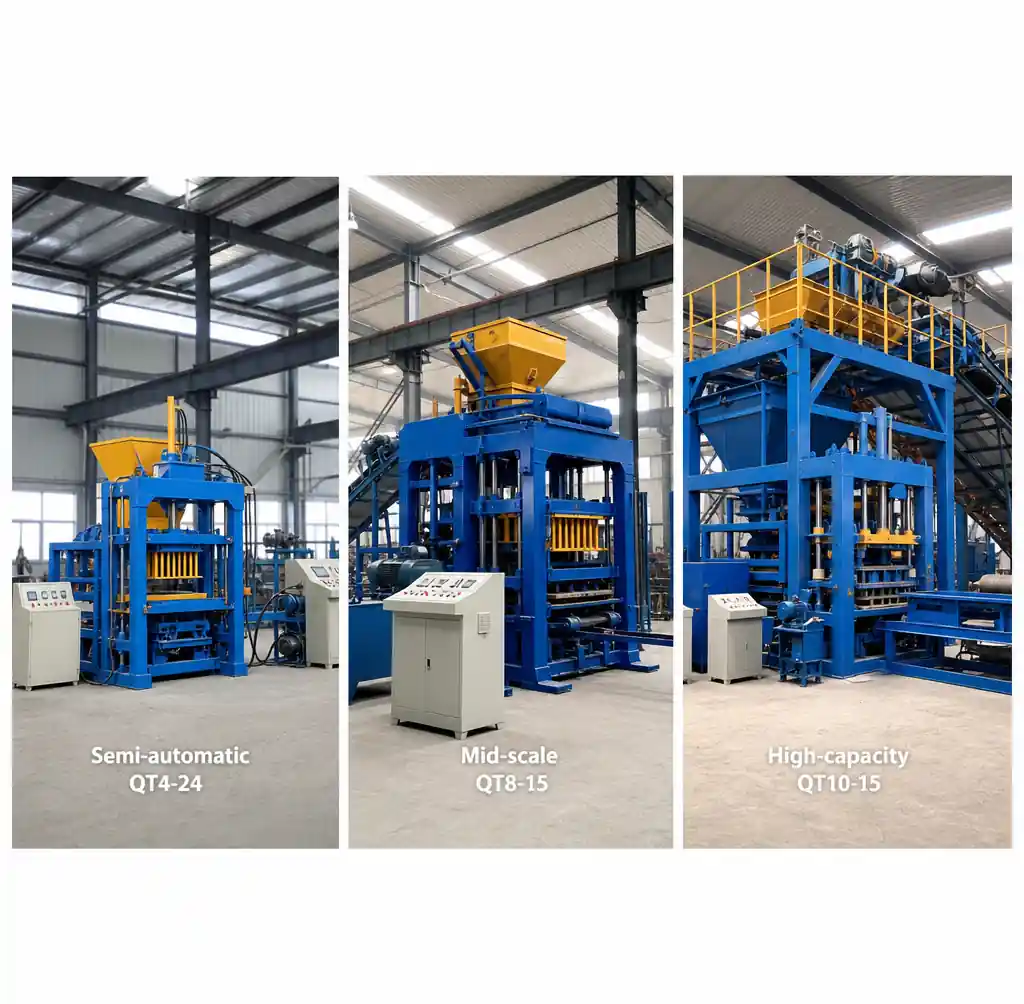
Energy usage varies dramatically based on automation level and production capacity. Manual hydraulic machines consume 8-15 kW during pressing cycles, while fully automatic systems draw 35-75 kW to power integrated material handling, automated batching, and continuous operation capabilities.
| Machine Type | Installed Power | Active Consumption | Blocks per Hour | Energy per Block | Daily Cost (8 hrs @ $0.12/kWh) |
|---|---|---|---|---|---|
| Manual Hydraulic | 8-15 kW | 5-10 kW average | 300-600 | 0.017-0.033 kWh | $4.80-$9.60 |
| Semi-Automatic | 18-35 kW | 12-25 kW average | 800-1,500 | 0.016-0.031 kWh | $11.50-$24.00 |
| Fully Automatic | 45-75 kW | 30-55 kW average | 2,500-4,000 | 0.012-0.022 kWh | $28.80-$52.80 |
| High-Capacity Line | 80-150 kW | 60-110 kW average | 5,000-8,000 | 0.012-0.022 kWh | $57.60-$105.60 |
The energy-per-block metric reveals that automation improves efficiency despite higher absolute consumption. Manual operations use 0.025-0.033 kWh per block while automatic systems achieve 0.012-0.018 kWh through optimized cycle timing and reduced idle periods.
Major Energy-Consuming Components
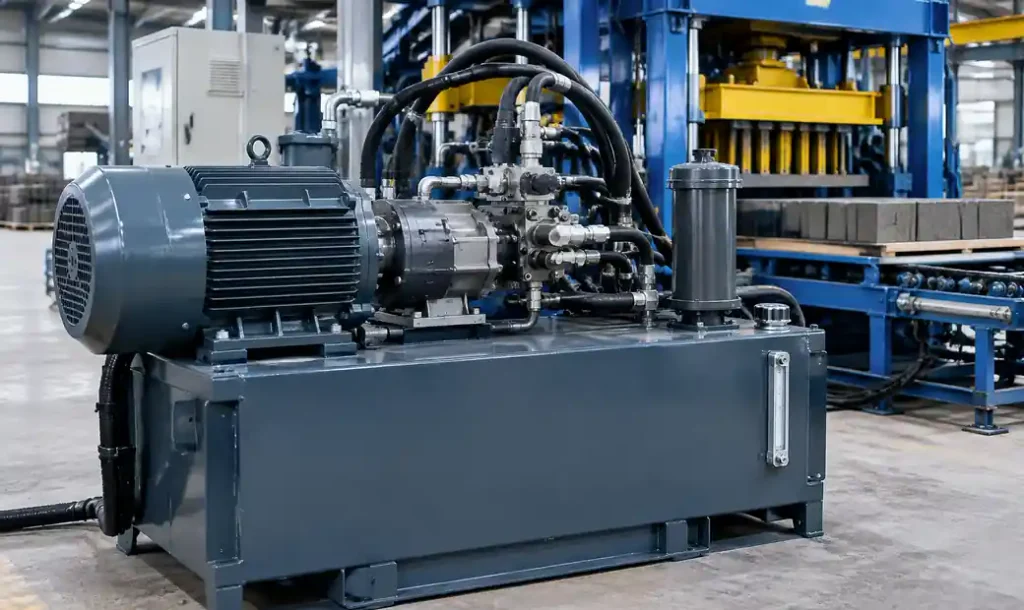
Hydraulic power unit: Consumes 40-55% of total machine energy. Electric motors (15-75 kW depending on capacity) drive hydraulic pumps maintaining 160-250 bar pressure for compression. Hydraulic system efficiency averages only 21% in conventional designs, with significant losses through heat generation and internal leakage.
Vibration system: Accounts for 20-30% of consumption. Vibration motors (2-8 kW) operate at 2,800-3,600 RPM with eccentric weights creating compaction forces. Duration matters—each additional second of vibration adds 0.0008-0.0015 kWh per block.
Material handling: Represents 15-25% in automatic systems. Conveyors, elevators, and transfer systems move 1.5-2.2 tonnes of material per 1,000 blocks, consuming 8-18 kW continuously during production.
Supporting systems: Include batching controls (1-3 kW), lighting (2-5 kW), and control panels (0.5-2 kW), totaling 5-10% of consumption.
Real Production Cost Analysis
Energy costs compound beyond the utility bill. Understanding total cost of energy consumption requires examining direct electricity charges, demand penalties, power factor surcharges, and operational inefficiencies.
Direct Electricity Costs
For a mid-scale operation producing 10,000 blocks daily using semi-automatic equipment:
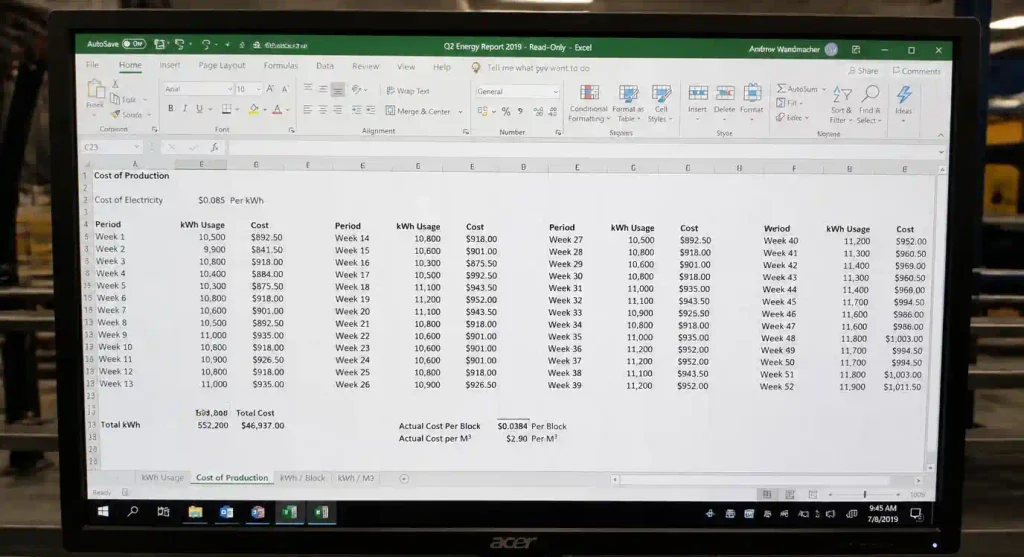
Baseline calculation:
- Machine consumption: 22 kW average × 8 hours = 176 kWh
- Supporting equipment: 15 kW × 10 hours = 150 kWh
- Curing room climate control: 12 kW × 24 hours = 288 kWh
- Total daily: 614 kWh
- Monthly (25 production days): 15,350 kWh
- Annual cost (@ $0.12/kWh): $22,104
Hidden Energy Costs
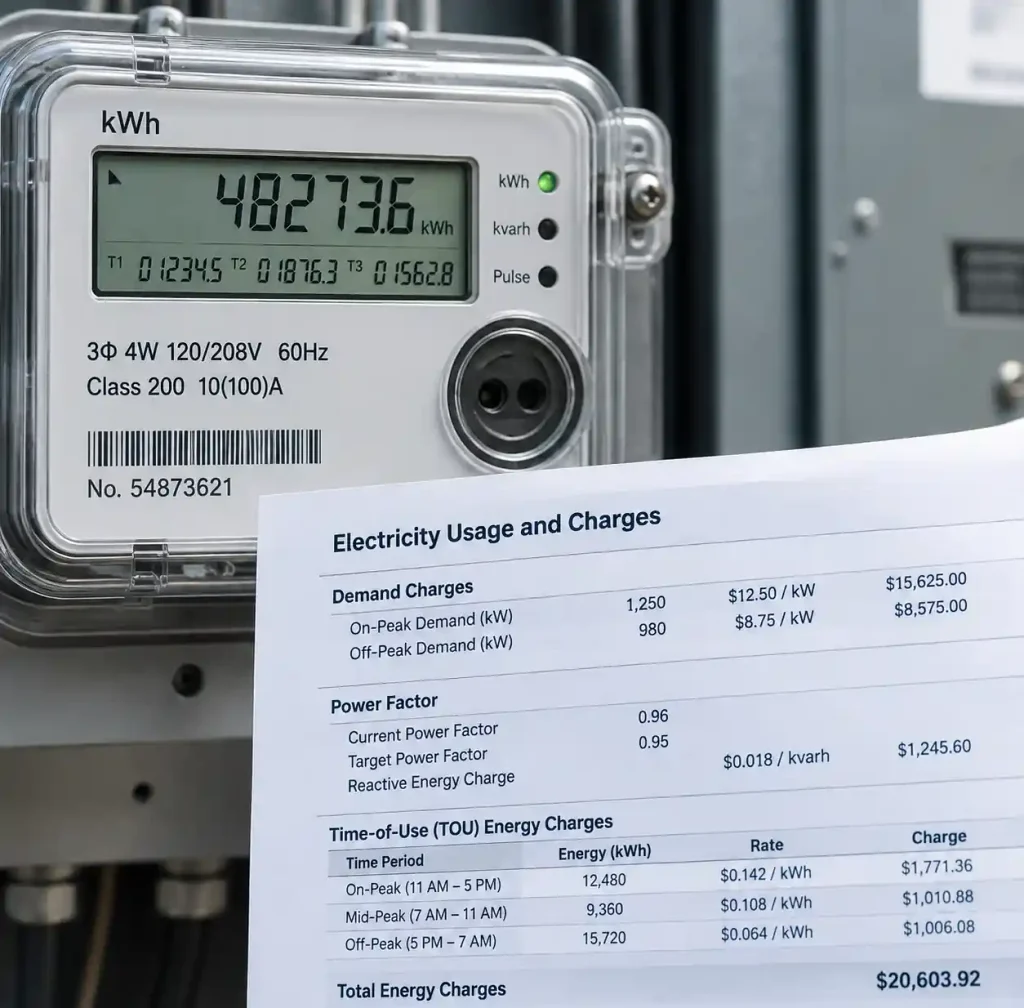
Demand charges: Industrial rates penalize peak demand. A 75 kW spike during startup can add $8-15/kW monthly ($600-1,125) regardless of total consumption. Staggered equipment startup reduces demand charges by 30-50%.
Power factor penalties: Motors operating below 0.85 power factor trigger surcharges of 1-3% per 0.01 below threshold. A facility at 0.78 power factor pays 7-21% extra. Installing capacitor banks ($2,500-6,000) corrects power factor to 0.95+, eliminating penalties within 8-14 months.
Inefficiency costs: Worn hydraulic pumps consume 15-25% more energy producing identical output. Oil operating at 70°C versus 55°C indicates system inefficiencies costing $150-280 monthly in a semi-automatic operation.
Energy Consumption Cost Comparison
| Cost Component | Manual Operation (3,000 blocks/day) | Semi-Automatic (10,000 blocks/day) | Fully Automatic (25,000 blocks/day) |
|---|---|---|---|
| Machine Energy | $1,440/month | $4,320/month | $12,672/month |
| Equipamento auxiliar | $540/month | $1,800/month | $3,240/month |
| Manuseamento de materiais | $180/month | $900/month | $3,600/month |
| Curing/Climate Control | $1,036/month | $3,456/month | $8,640/month |
| Demand Charges | $240/month | $720/month | $1,800/month |
| Power Factor Penalty | $95/month | $315/month | $900/month |
| Total Monthly | $3,531 | $11,511 | $30,852 |
| Cost per Block | $0.039 | $0.038 | $0.041 |
| % of Production Cost | 14-18% | 12-16% | 11-15% |
While absolute costs scale with capacity, per-block energy costs remain remarkably consistent at $0.035-0.045 across automation levels—approximately 12-16% of total production costs when raw materials run $0.22-0.28 per block.
Proven Energy Optimization Strategies
Systematic optimization addresses consumption patterns, equipment efficiency, operational scheduling, and supporting system management. Implementations achieving 25-40% energy reduction focus on high-impact interventions rather than marginal adjustments.
Variable Frequency Drives for Motors
VFDs reduce motor energy consumption by 20-80% depending on load variability. Block machines experience significant load fluctuations—hydraulic pumps need full power during compression (8-12 seconds) but minimal flow during mold opening and material loading (15-20 seconds).
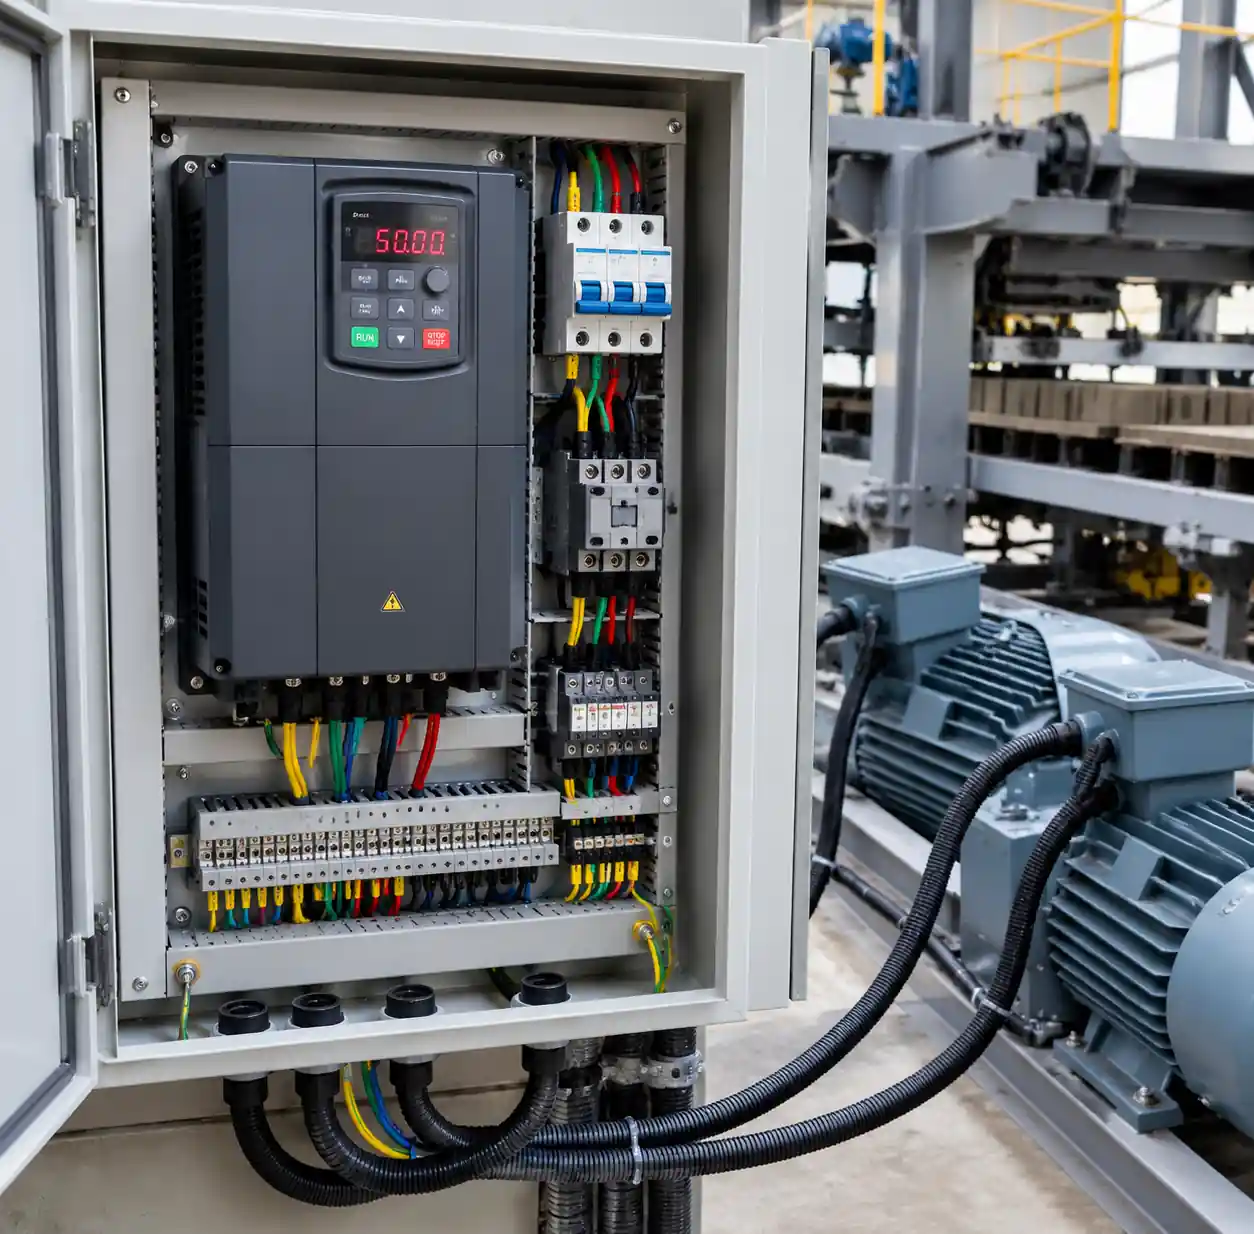
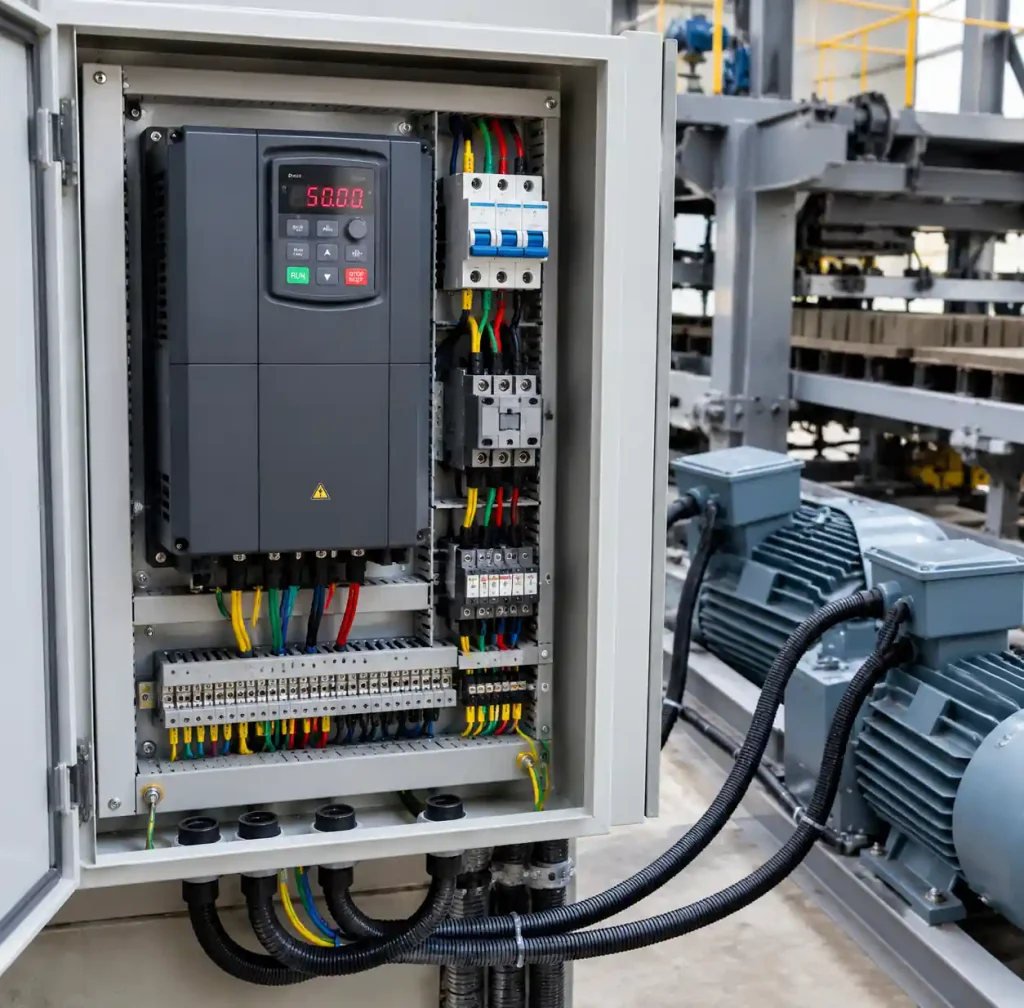
Implementation: Install VFDs on hydraulic pump motors (15-45 kW) and material handling systems. During non-compression phases, reduce motor speed to 40-60% rather than running full speed with pressure relief valves dumping excess flow as heat.
Savings calculation: A 30 kW hydraulic motor running 8 hours daily at constant speed consumes 240 kWh. With VFD reducing speed 50% during 60% of cycle time, consumption drops to 180 kWh (75% × 40% + 100% × 60% = 75% average)—saving 60 kWh daily or $216 monthly at $0.12/kWh. VFD cost ($1,800-3,500) recovers in 8-16 months.
Hydraulic System Efficiency Improvements
Hydraulic systems waste approximately 79% of input energy as heat, making them prime optimization targets. Efficiency gains come through pressure optimization, leak elimination, and component upgrades.
Pressure calibration: Operating at 200 bar when 180 bar achieves identical block quality wastes 11% energy (pressure squared relationship). Test at 10-bar increments to identify minimum effective pressure for each block type.
Premium hydraulic components: Upgrading to piston pumps from gear pumps reduces consumption 12-18%. Initial cost premium ($2,200-4,500) recovers within 18-24 months through efficiency gains on machines operating 12+ hours daily.
Oil temperature management: Each 10°C above 55°C cuts hydraulic oil life by 50% while increasing energy consumption 3-5%. Installing oil coolers ($1,200-2,800) maintains optimal temperature, reducing energy waste and extending oil change intervals from 1,200 to 2,000+ hours.
Production Scheduling Optimization
Time-of-use (TOU) electricity rates create 40-60% price differences between peak and off-peak periods. Strategic scheduling shifts energy-intensive operations to lower-rate windows.
Rate structure example:
- Peak hours (10 AM – 6 PM): $0.18/kWh
- Mid-peak (6 AM – 10 AM, 6 PM – 10 PM): $0.12/kWh
- Off-peak (10 PM – 6 AM): $0.07/kWh
Optimization approach: Schedule curing room heating/cooling during off-peak hours using thermal mass storage. Pre-heat or pre-cool 2-3 hours before peak rates begin, then reduce climate control during expensive periods. Run material crushing and screening during off-peak shifts. This reduces monthly costs $800-1,600 for mid-scale operations.
Demand management: Stagger equipment startup across 15-20 minutes rather than simultaneous power-up. Starting mixers, conveyors, and block machines sequentially reduces peak demand from 85 kW to 62 kW—saving $184-345 monthly in demand charges.
Equipment-Specific Optimizations
Vibration System Efficiency
Vibration duration directly correlates with energy consumption and block quality. Insufficient vibration creates weak blocks; excessive vibration wastes energy without improving strength.
Testing protocol: Produce test batches at 3, 4, 5, and 6 seconds vibration. Test compression strength after 7-day cure. Identify minimum vibration time achieving target strength (typically 18-22 MPa for standard hollow blocks). Reducing vibration from 6 to 4 seconds saves 0.0016-0.0030 kWh per block—$480-900 annually on 10,000 daily production.
Vibration motor maintenance: Worn bearings increase friction, requiring 8-15% more energy. Replace bearings every 3,000-4,000 hours ($180-320) to maintain efficiency. Imbalanced eccentric weights create irregular vibration patterns requiring longer compaction time—rebalance annually.
Mixer Energy Optimization
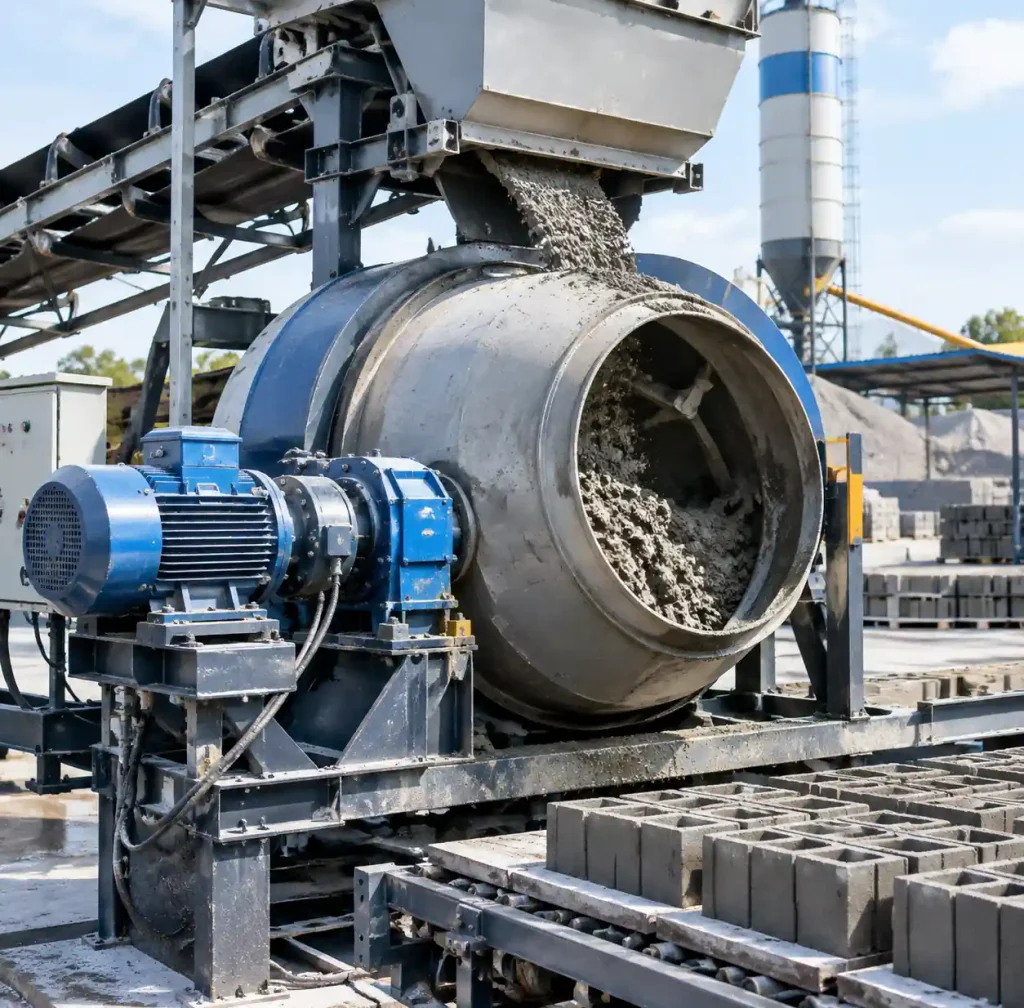
Concrete mixers consume 15-30 kW for 60-90 seconds per batch. Mixer type significantly influences energy requirements and material consistency.
Mix time optimization: Over-mixing wastes energy and can reduce strength through aggregate breakdown. Test batches at 60, 75, and 90 seconds to identify minimum mixing time achieving proper consistency. Reducing from 90 to 70 seconds saves 22% energy per batch.
Batching accuracy: Automated batching with ±2% accuracy eliminates manual errors causing inadequate mixing or unnecessary remix cycles. Each remix batch wastes 18-30 kWh plus 12-15 minutes production time.
Compressed Air System Management
Facilities using pneumatic controls and cleaning systems often overlook compressed air leaks costing $2,000-5,000 annually. A 3mm leak at 90 PSI wastes 35 CFM—equivalent to running a 7.5 kW compressor continuously.
Leak detection: Monthly ultrasonic inspection identifies leaks during non-production hours. Repairing 10-15 typical leaks reduces compressor runtime 20-35%, saving 800-1,400 kWh monthly.
Pressure reduction: Lowering system pressure from 100 to 90 PSI reduces compressor energy consumption 5-7% if equipment operates properly at lower pressure. Test pneumatic actuators and controls at reduced pressure before permanent adjustment.
Advanced Energy Management
Real-Time Monitoring Systems
Energy management systems track consumption by equipment and production phase, identifying inefficiencies invisible in monthly utility bills. Systems cost $3,500-12,000 depending on monitoring points and analytics capabilities.
Key metrics: Energy per block, machine idle time percentage, peak demand events, power factor trends, and component-level consumption. Weekly reports highlight deviations from baseline efficiency.
ROI: A 10,000-block operation reducing consumption 8% through monitoring-driven adjustments saves $900-1,100 monthly—recovering system cost in 4-11 months.
Motor Efficiency Upgrades
Replacing standard-efficiency motors (85-88% efficiency) with premium-efficiency models (92-96% efficiency) reduces consumption 4-8%. For a 30 kW motor operating 3,000 hours annually:
Savings calculation:
- Standard motor: 30 kW ÷ 0.87 = 34.48 kW input × 3,000 hrs = 103,440 kWh
- Premium motor: 30 kW ÷ 0.94 = 31.91 kW input × 3,000 hrs = 95,730 kWh
- Annual savings: 7,710 kWh × $0.12 = $925
Premium motor cost premium ($800-1,600) recovers in 10-20 months. Premium motors also extend operational life 30-50% through better thermal management.
Energy Optimization Implementation Roadmap
| Priority | Optimization Action | Implementation Cost | Annual Savings (10K blocks/day) | Payback Period | Complexity |
|---|---|---|---|---|---|
| High | Hydraulic pressure calibration | $0 | $1,200-2,400 | Immediate | Low |
| High | Eliminate compressed air leaks | $200-600 | $1,800-3,600 | 1-3 months | Low |
| High | Vibration time optimization | $0 | $900-1,600 | Immediate | Low |
| Medium | VFD on hydraulic pump | $1,800-3,500 | $2,160-3,600 | 8-16 months | Medium |
| Medium | Power factor correction | $2,500-6,000 | $1,800-3,000 | 10-20 months | Medium |
| Medium | TOU rate scheduling | $0-1,500 | $1,200-2,400 | 0-8 months | Medium |
| Lower | Premium efficiency motors | $800-1,600 each | $600-1,200 per motor | 10-20 months | High |
| Lower | Energy monitoring system | $3,500-12,000 | $900-1,800 | 24-36 months | High |
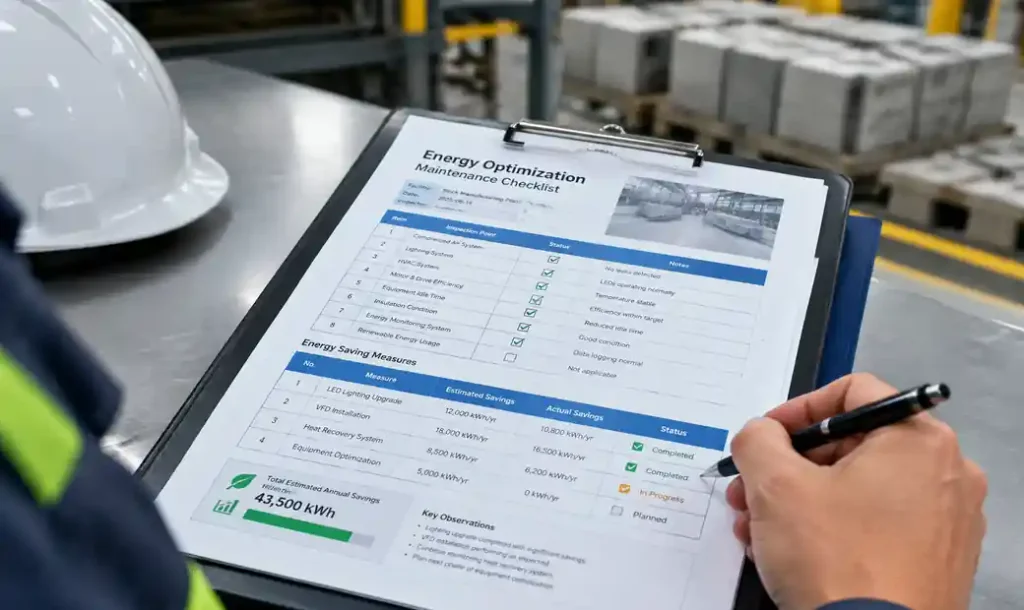
Implementation sequence: Begin with zero-cost optimizations (pressure calibration, vibration timing) delivering immediate returns. Next, address power quality issues (power factor, compressed air leaks) with moderate investment and 1-6 month payback. Finally, implement control upgrades (VFDs, monitoring systems) requiring higher capital but sustaining long-term efficiency.
Comparing Energy Efficiency Across Technologies
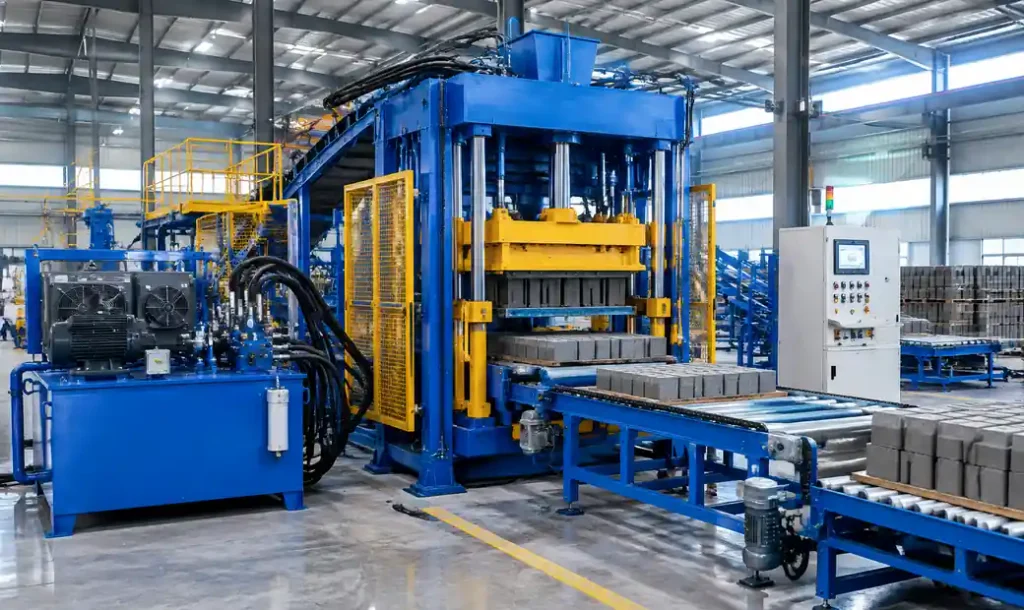
Different block-making technologies present distinct energy profiles. Understanding these differences informs equipment selection for new operations and upgrade decisions for existing facilities.
| Technology | Energy Intensity | Quality Consistency | Capital Cost | Best Application |
|---|---|---|---|---|
| Vibration-only | 0.025-0.035 kWh/block | 75-85% within spec | Low | Non-structural blocks, price-sensitive markets |
| Mechanical Press | 0.030-0.045 kWh/block | 88-93% within spec | Medium | Medium-volume standard blocks |
| Hydraulic Press | 0.012-0.022 kWh/block | 95-98% within spec | High | High-quality structural blocks, diverse products |
| Hydraulic + VFD | 0.009-0.017 kWh/block | 95-98% within spec | High | Energy-conscious operations, premium products |
Hydraulic systems with variable frequency drives deliver 25-40% better energy efficiency than conventional mechanical presses while producing superior block quality. Though initial investment runs 30-50% higher, energy savings plus reduced waste recovery costs within 18-36 months for operations exceeding 8,000 blocks daily.
Frequently Asked Questions
What percentage of block production costs is energy?
Energy typically represents 12-16% of total production costs. For blocks costing $0.28-0.32 to produce, electricity accounts for $0.035-0.050 per block. This percentage increases in regions with high electricity rates (>$0.15/kWh) and decreases where raw material costs dominate.
How much can VFDs reduce energy consumption?
Variable frequency drives reduce motor energy consumption 20-35% in block machine applications where load varies significantly during production cycles. Hydraulic pump motors see the greatest savings since they require full power only during compression phases (30-40% of cycle time).
What’s the most cost-effective energy optimization?
Hydraulic pressure calibration delivers immediate savings without investment. Testing to find minimum effective pressure often reveals 10-15% overcapacity—reducing pressure from 200 to 180 bar saves $1,200-2,400 annually on a 10,000-block daily operation.
Do automatic machines use more total energy?
Automatic systems consume more absolute energy (30-55 kW vs 12-25 kW for semi-automatic) but produce blocks more efficiently. Energy per block drops to 0.012-0.022 kWh for automatic versus 0.016-0.031 kWh for semi-automatic through optimized cycle timing and elimination of idle periods.
How do time-of-use rates affect production scheduling?
TOU rates create 40-60% price differences between peak and off-peak periods. Shifting energy-intensive operations (material processing, curing climate control) to off-peak hours reduces costs $800-2,000 monthly for mid-scale operations. Requires analyzing rate structure and production flexibility.
What causes unexpected energy consumption increases?
Common causes include worn hydraulic pump components (15-25% increase), oil operating above optimal temperature (3-5% per 10°C), compressed air leaks (20-35% compressor runtime increase), and motor bearing wear (8-15% increase). Monthly consumption tracking identifies developing inefficiencies before major failures.
Is solar power economical for block production?
Solar economics depend on local electricity rates, available incentives, and production schedules. Operations running primarily during daylight hours with rates above $0.14/kWh often achieve 5-8 year payback. Night production or rates below $0.10/kWh extend payback beyond 12-15 years without substantial incentives.
How does humidity control in curing affect energy costs?
Proper curing requires 20-25°C and 90%+ humidity for 7 days. Climate control for a 2,000 m² curing area costs $3,000-6,000 monthly in moderate climates, reaching $8,000-12,000 in extreme conditions. Insulated curing chambers with thermal mass storage reduce costs 25-40% versus open-air misting systems.
Conclusão
Energy represents 12-16% of block production costs, yet receives far less attention than cement purchasing or labor management. Systematic optimization targeting hydraulic efficiency, motor control, and production scheduling reduces consumption 25-40% without compromising output or quality. Starting with zero-cost calibrations, then progressing through power quality improvements and control system upgrades, operations achieve payback within 8-24 months while establishing sustainable competitive advantages.
The most successful implementations combine multiple strategies: pressure optimization eliminates waste, VFDs match motor speed to actual demand, TOU scheduling exploits rate structures, and monitoring systems sustain efficiency through operational changes. For producers facing margin pressure from raw material costs, energy optimization delivers controllable savings compounding across years of operation.
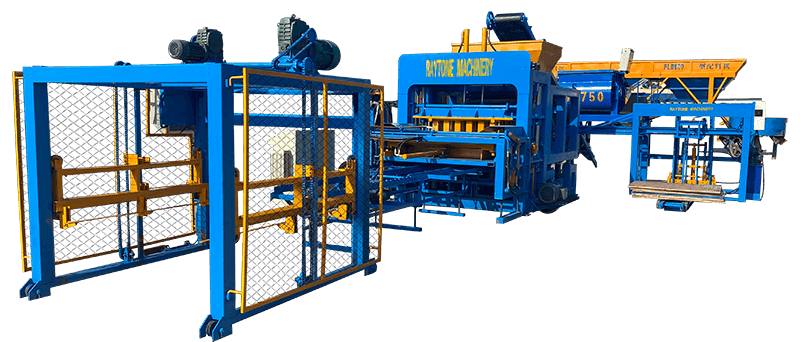
Raytone Block Machinery designs hydraulic block machines with energy efficiency integrated from initial specifications. Our systems include variable frequency drives, optimized hydraulic circuits, and precision controls that reduce consumption 30-45% compared to conventional designs. From semi-automatic solutions for growing operations to complete automatic production lines, we provide equipment engineered for long-term operational economy.
Contact our engineering team to analyze your current energy consumption and develop customized optimization strategies matched to your production requirements and local rate structures.