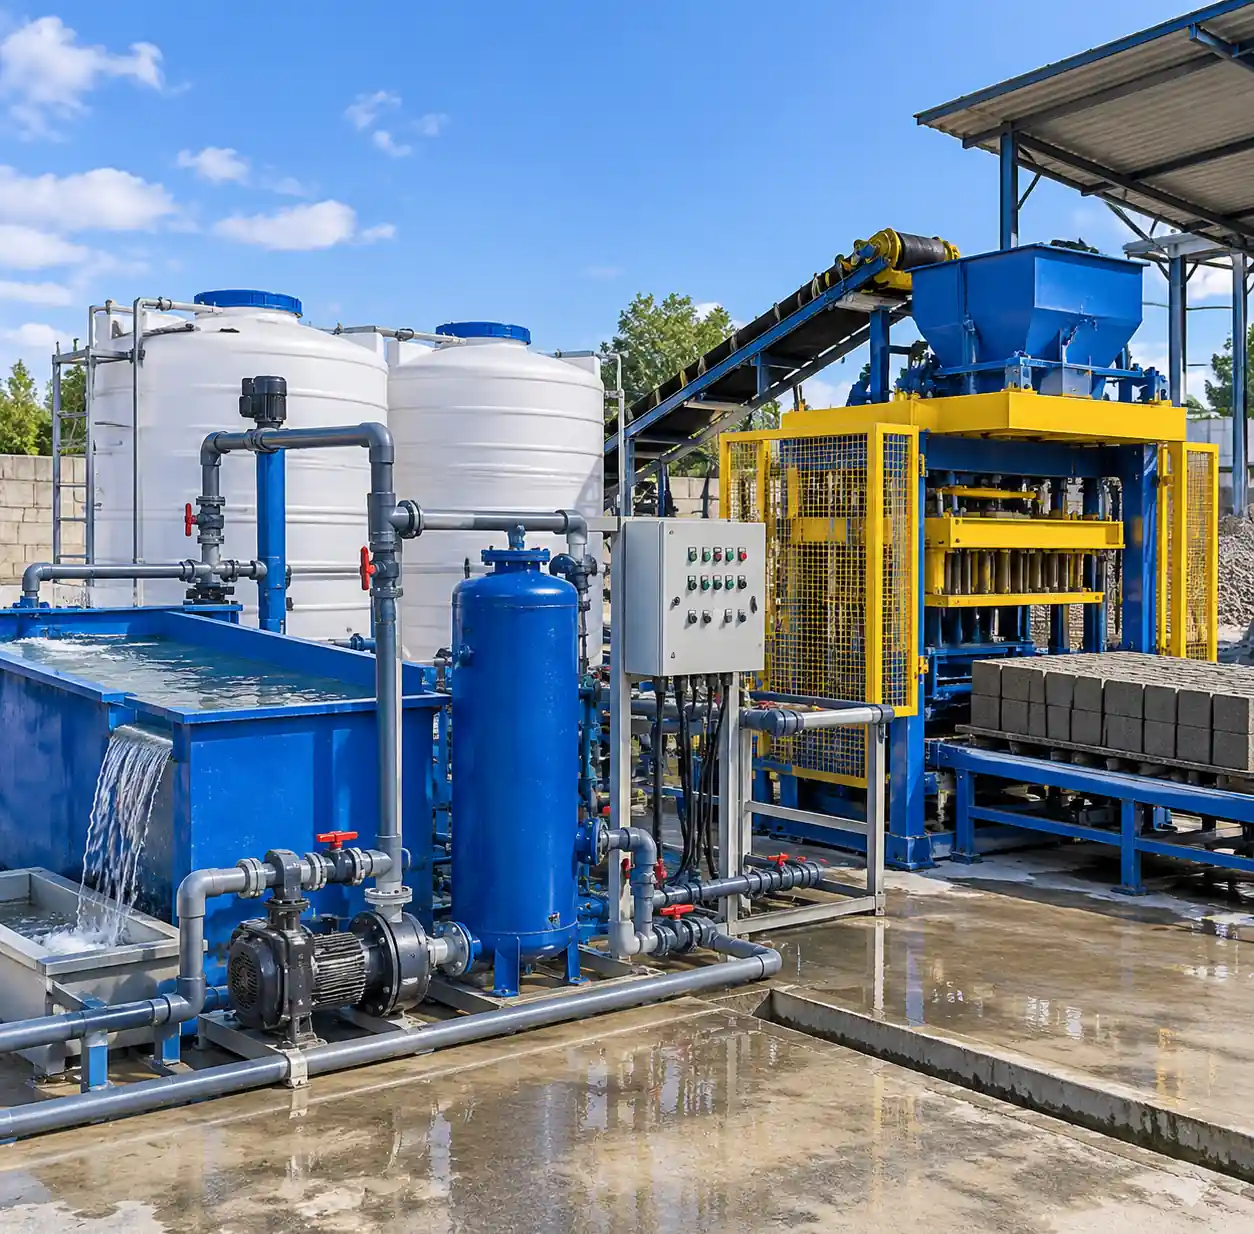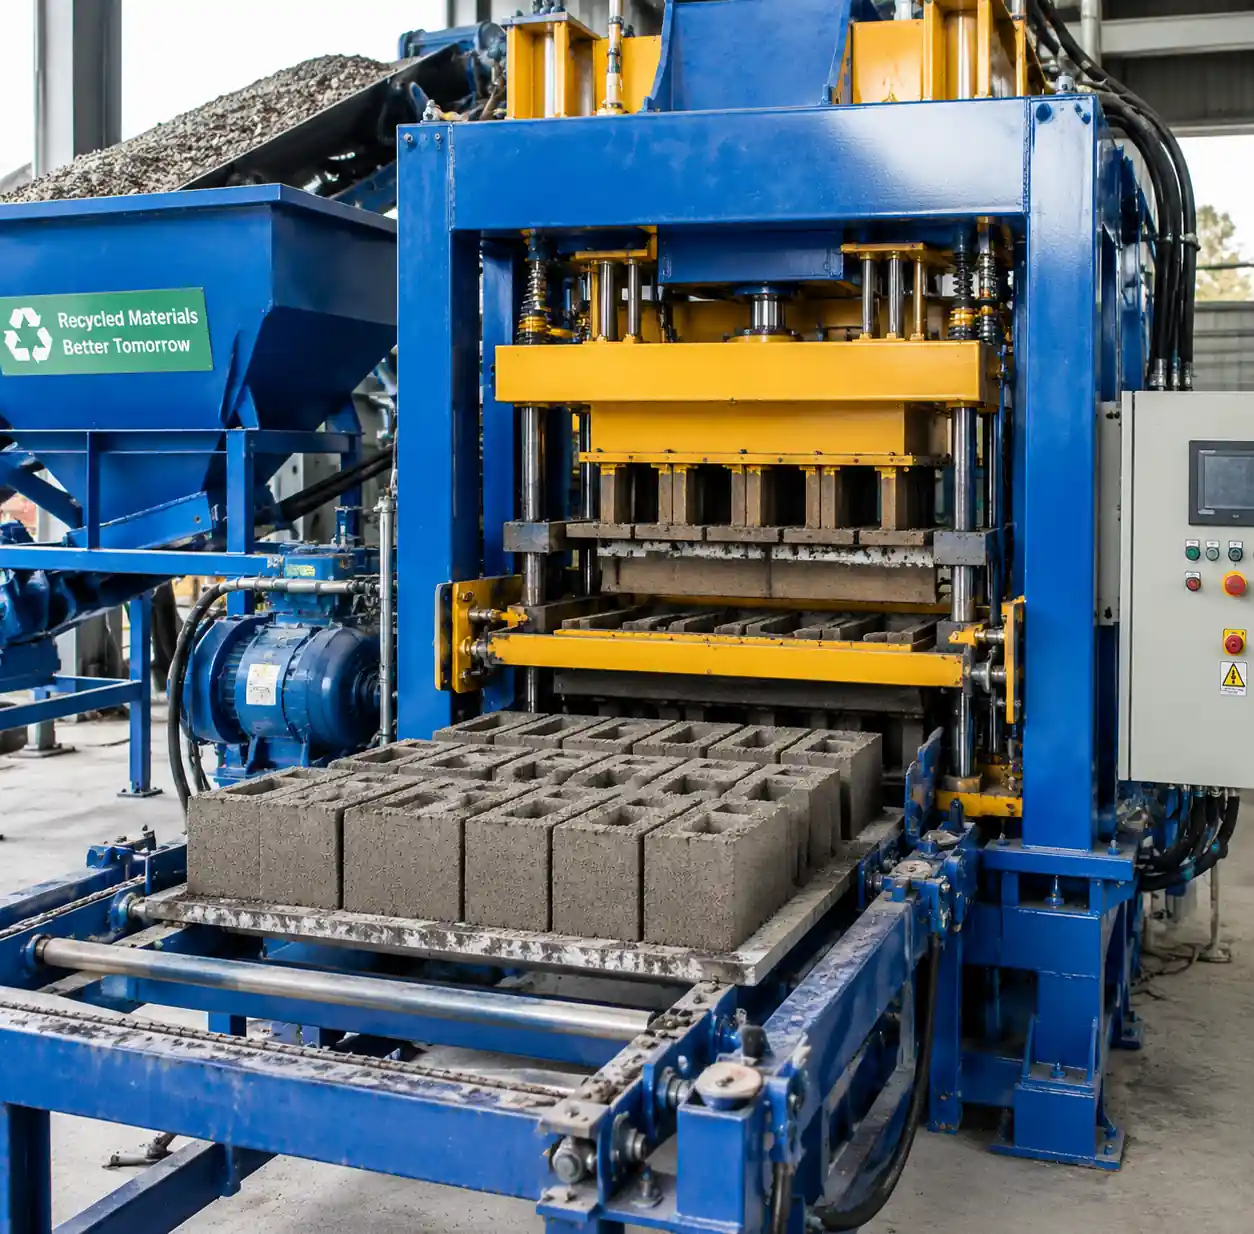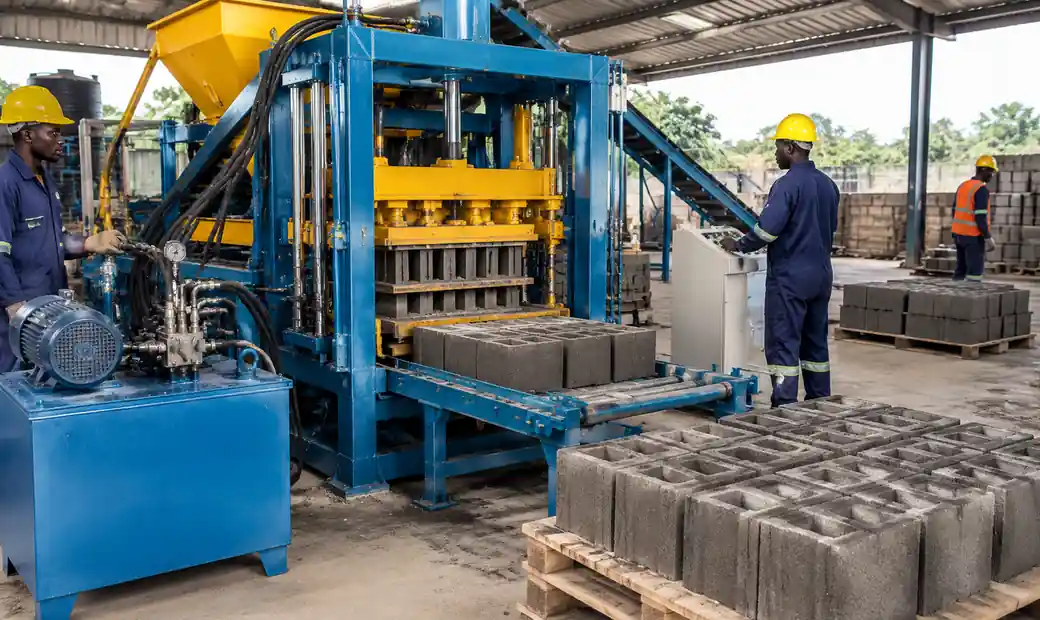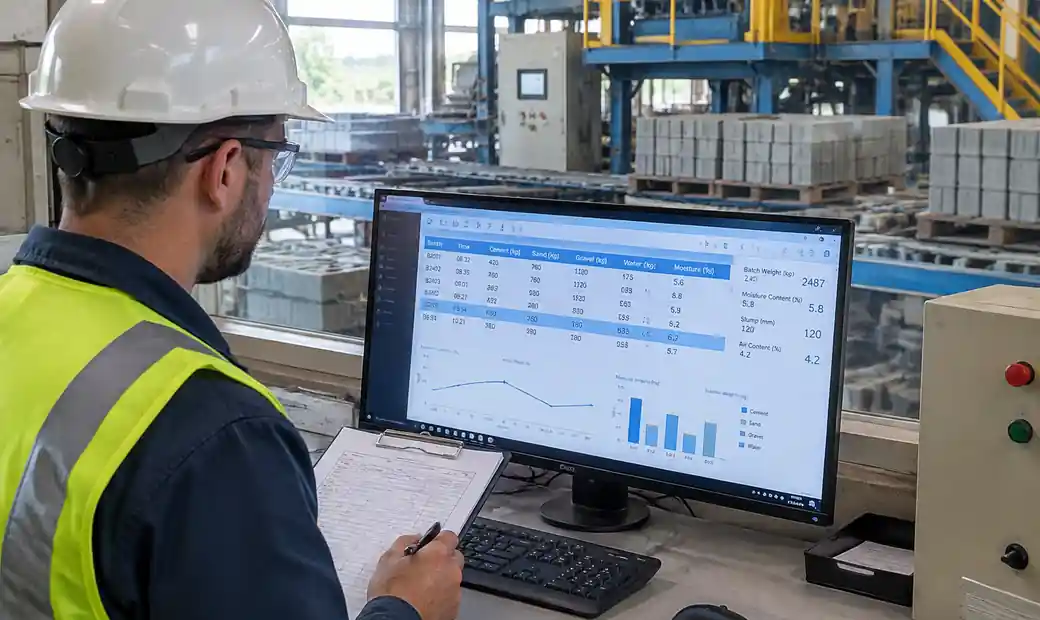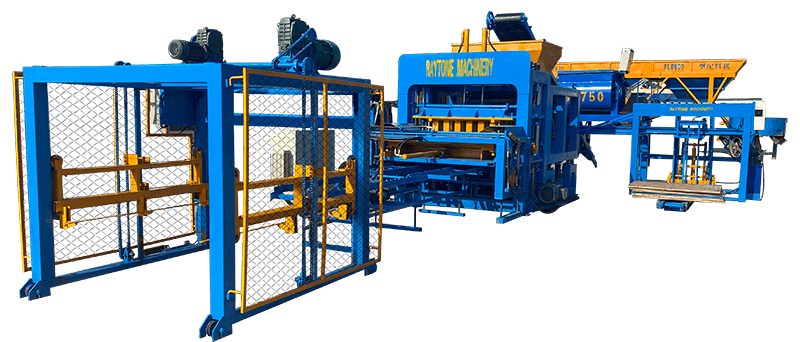
The global concrete block and brick making market reached $6.1 billion in 2025, projected to grow at 8.6% annually through 2026 as infrastructure development and affordable housing initiatives accelerate worldwide. For entrepreneurs evaluating block manufacturing, the difference between profitability and failure lies in understanding capital requirements, production economics, and market positioning before the first block is molded.
This business plan template provides the framework operators use to secure financing, optimize production costs, and build sustainable revenue—not generic templates that ignore the specific economics of cement, labor, and machinery that determine whether your operation reaches break-even in 12 months or struggles for years.
Why Block Manufacturing Remains a Viable Business in 2026
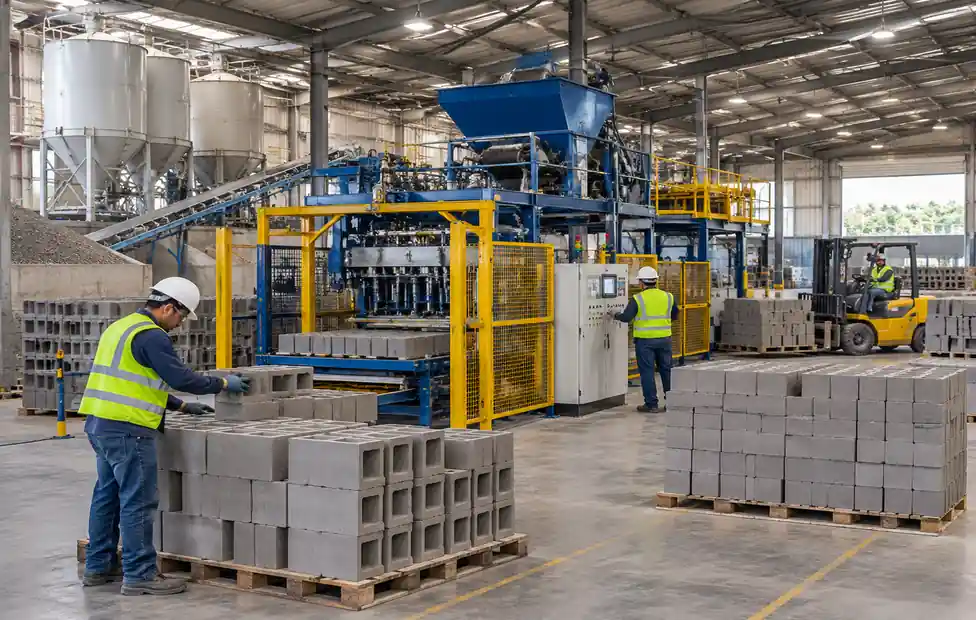
Block manufacturing serves construction’s most fundamental demand: structural masonry units. Unlike discretionary building materials, concrete blocks remain essential for foundations, load-bearing walls, and infrastructure projects regardless of architectural trends or economic cycles.
The business model converts cement, aggregates, and sand—commodities available in every regional market—into finished products commanding 2-3× raw material costs. According to industry data, standard hollow blocks costing $0.57 in materials sell for $1.20-$1.80 retail, generating 40-55% gross margins when production reaches 60-70% capacity utilization.
Market barriers favor established producers: equipment costs ($8,000-$120,000), technical knowledge requirements, and space needs (5,000-50,000 sq ft) create natural entry friction. Once operational, producers with consistent quality and reliable delivery build contractor relationships that resist price competition from new entrants.
Executive Summary: One-Page Business Overview
Every business plan starts with an executive summary capturing your opportunity, competitive advantage, and financial projections in 300-400 words. Investors and lenders read this section first—often deciding whether to continue based solely on these paragraphs.
| Component | Key Content |
|---|---|
| Business Concept | Production capacity (blocks/day), automation level, target market segment |
| Market Opportunity | Local construction growth rate, underserved demand, competitive landscape |
| Competitive Advantage | Quality consistency, delivery reliability, or cost structure vs. incumbents |
| Financial Highlights | Total investment, break-even timeline, 3-year revenue trajectory, ROI |
| Management Team | Production, sales, or construction industry experience relevant to operations |
| Funding Request | Capital required, use of funds, debt-to-equity structure |
Your executive summary must quantify the opportunity: “Supply 15,000-20,000 blocks monthly to residential contractors in [Region], capturing 12-15% of the estimated 150,000 monthly demand currently imported from adjacent markets at 20-25% transport markup.” Generic statements about “growing construction” or “quality products” lack the specificity that separates serious operators from undercapitalized ventures.
Company Description: Positioning and Operations Model
Legal Structure and Ownership
Block manufacturing typically operates as an LLC or corporation, providing liability protection critical when production equipment generates 80-250 tons of compression force. Single-member LLCs work for owner-operated plants; multi-member structures accommodate investor partnerships or family ownership.
State registration costs $100-$800 depending on jurisdiction. Federal EIN acquisition takes 10-15 minutes online at no cost. Business insurance—general liability ($1,200-$2,400/year) and product liability ($1,800-$3,600/year)—protects against claims from defective blocks or equipment-related injuries.
Production Model Selection
Your production model determines capital requirements, labor costs, and achievable margins:
Manual Production requires $8,000-$15,000 equipment investment, produces 800-1,600 blocks per shift with 4-6 workers at $0.12-$0.18 labor cost per block. This model suits rural markets where construction progresses seasonally and electrical infrastructure remains unreliable.
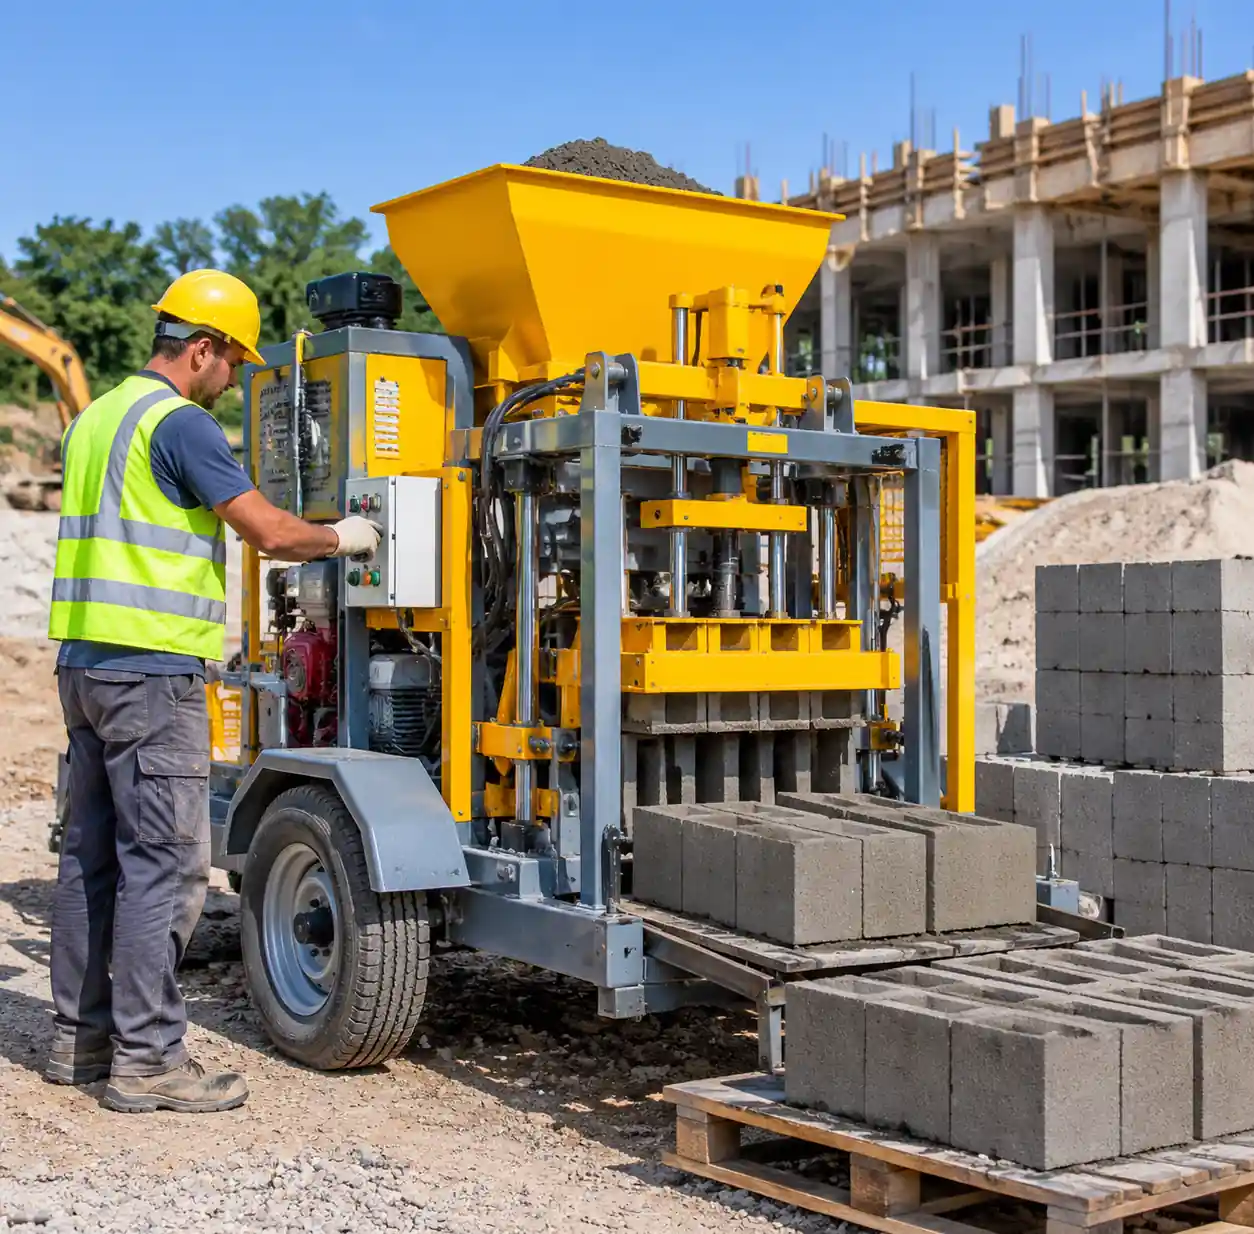
Semi-Automatic Production costs $12,000-$28,000, produces 1,200-3,600 blocks per shift with 2-4 operators at $0.05-$0.09 labor per block. Máquinas semiautomáticas balance affordability with hydraulic precision, dominating small-to-medium scale operations.
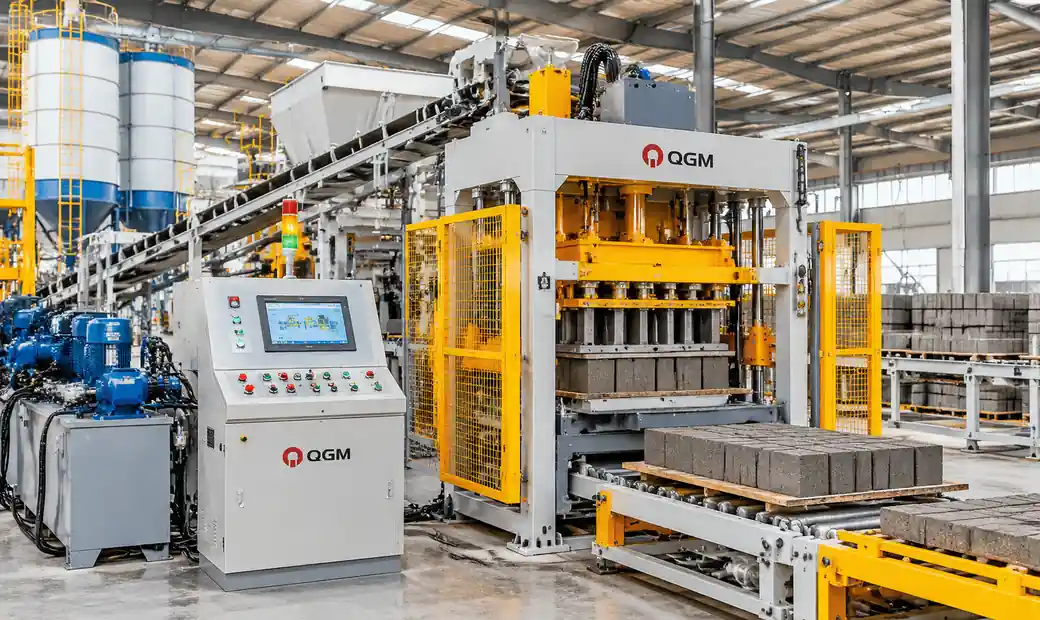
Fully Automatic Production requires $35,000-$120,000 investment, produces 5,000-46,000 blocks per shift with 2-6 operators at $0.018-$0.038 labor per block. Automatic plants achieve lowest per-unit costs but demand higher initial capital and three-phase power infrastructure.
Market Analysis: Demand Validation and Competition
Target Market Identification
Block demand segments into three categories with distinct purchasing patterns:
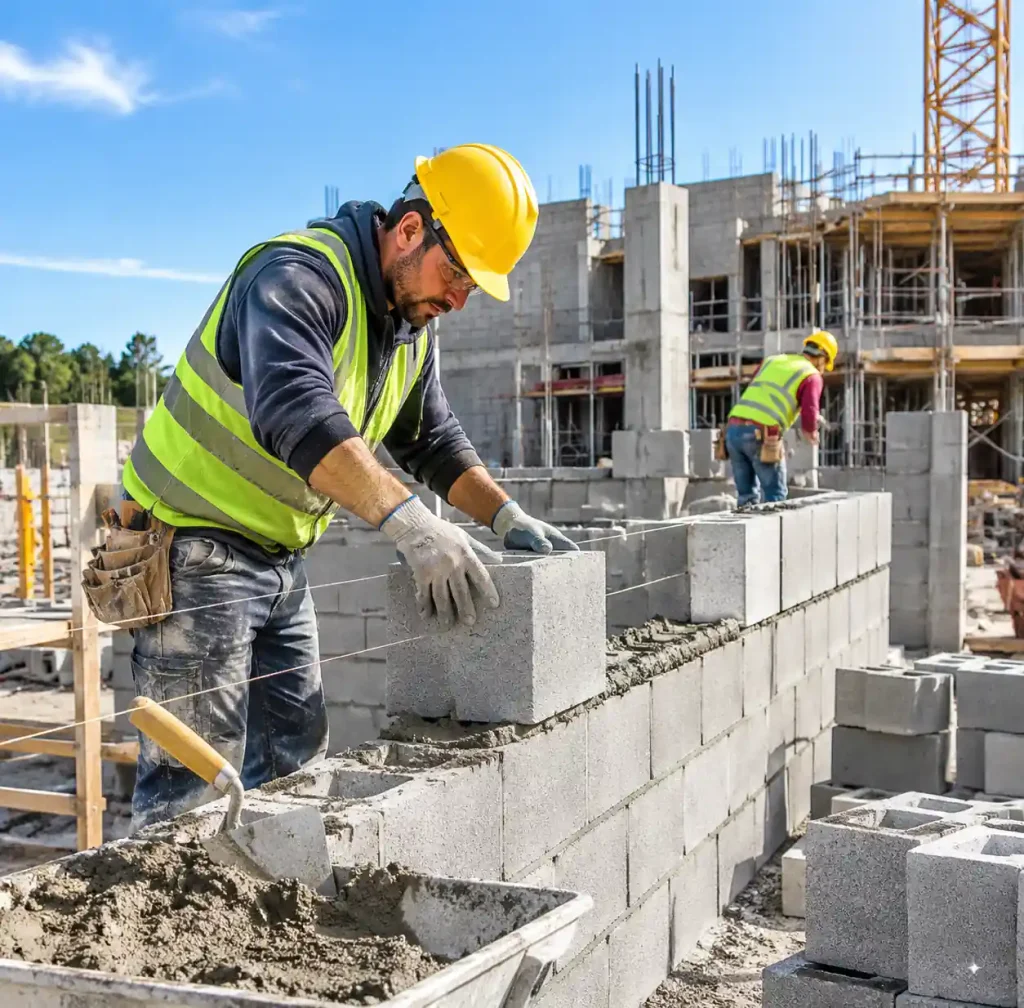
Residential Construction (40-50% of market): Individual homebuilders and small contractors purchasing 500-3,000 blocks per project. These buyers prioritize availability and delivery reliability over 5-8% price differences. Average project frequency: 2-4 homes annually per contractor.
Commercial Construction (30-35% of market): Mid-size contractors on multi-unit, retail, or light industrial projects requiring 5,000-25,000 blocks. Purchase decisions emphasize consistent quality for structural compliance and payment terms (30-60 day net common).
Government/Infrastructure (15-25% of market): Large-scale housing projects, schools, or road construction consuming 50,000-200,000+ blocks. These contracts demand quality certifications, bid pricing, and 60-90 day payment cycles but provide volume stability.
Understanding which segment you serve determines equipment capacity, working capital needs, and competitive positioning. Attempting to serve all three simultaneously without adequate production capacity spreads resources across incompatible operational requirements.
Competitive Landscape Analysis
Analyze existing suppliers within your distribution radius (typically 50-150 miles for blocks weighing 35-50 lbs):
| Competitive Factor | Assessment Questions |
|---|---|
| Capacidad de producción | Are competitors operating at 70-80%+ capacity with delivery delays? |
| Quality Consistency | Do contractors complain about dimensional variations or strength issues? |
| Pricing Structure | What is the current market price vs. your projected production cost? |
| Delivery Reliability | Are suppliers consistently meeting promised delivery windows? |
| Product Range | Do existing producers offer hollow, solid, interlocking, and paver options? |
Viable market entry requires identifying a gap: underserved demand exceeding existing capacity, quality inconsistency creating contractor dissatisfaction, or specialty products (interlocking blocks, architectural finishes) unavailable locally.
Equipment and Facility Requirements
Production Equipment Investment
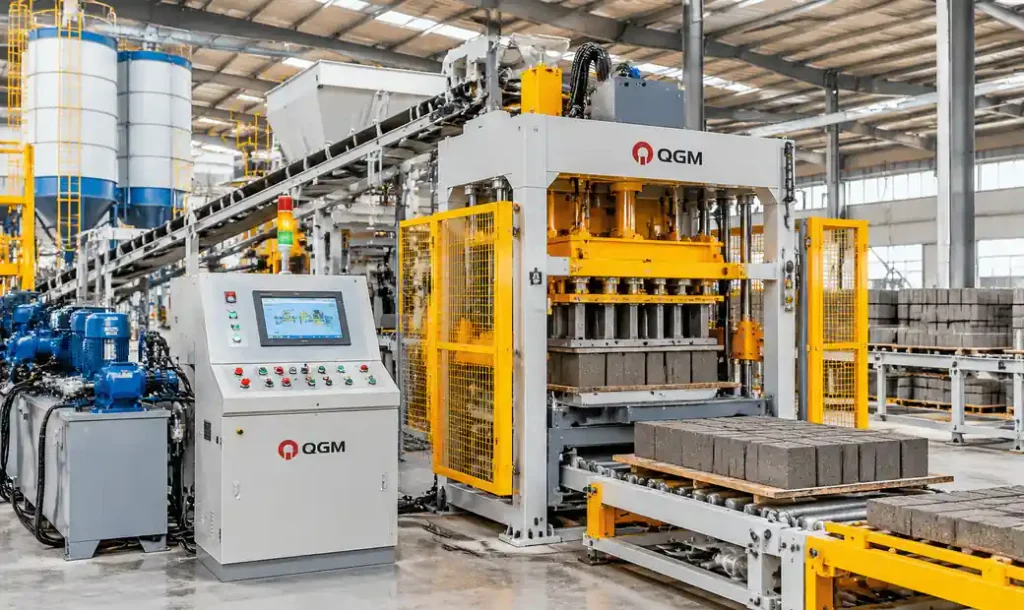
Equipment selection drives every downstream business decision—production capacity, labor needs, power requirements, and maintenance costs all stem from your machinery choice.
| Tipo de máquina | Investment | Capacidad diaria | Power Needs | Mano de obra necesaria |
|---|---|---|---|---|
| Manual del QT4-40 | $9,000-$12,500 | 1,200-1,600 blocks | None (manual) | 4-6 workers |
| QT4-30 semiautomática | $14,000-$18,000 | 1,600-2,400 blocks | 240V, 14.8kW | De 2 a 4 trabajadores |
| QT8-15 Automático | $32,000-$38,000 | 5,000-7,200 blocks | 415V three-phase, 36.75kW | 2-3 workers |
| QT10-15 Automático | $95,000-$125,000 | 20,000-46,000 blocks | 415V three-phase, 51.25kW | 3-6 workers |
Supporting equipment adds 35-50% to core machine costs: concrete mixers ($2,800-$12,000), batching systems ($1,500-$8,000), conveyors ($3,500-$15,000), and pallets ($2,000-$8,000 for 500-1,500 units).
Read our comprehensive equipment comparison for detailed capacity and ROI analysis.
Facility and Space Planning
Block manufacturing requires purpose-built or adapted industrial space with specific zones:
Production Area: 1,500-8,000 sq ft depending on equipment size, requiring level concrete floors capable of supporting 8-12 tons per square meter under vibrating equipment.
Curing Yard: 3,000-25,000 sq ft for block curing over 7-28 days. Calculate as: (daily production × curing days) / blocks per pallet × pallet footprint (typically 2.5-4 sq ft).
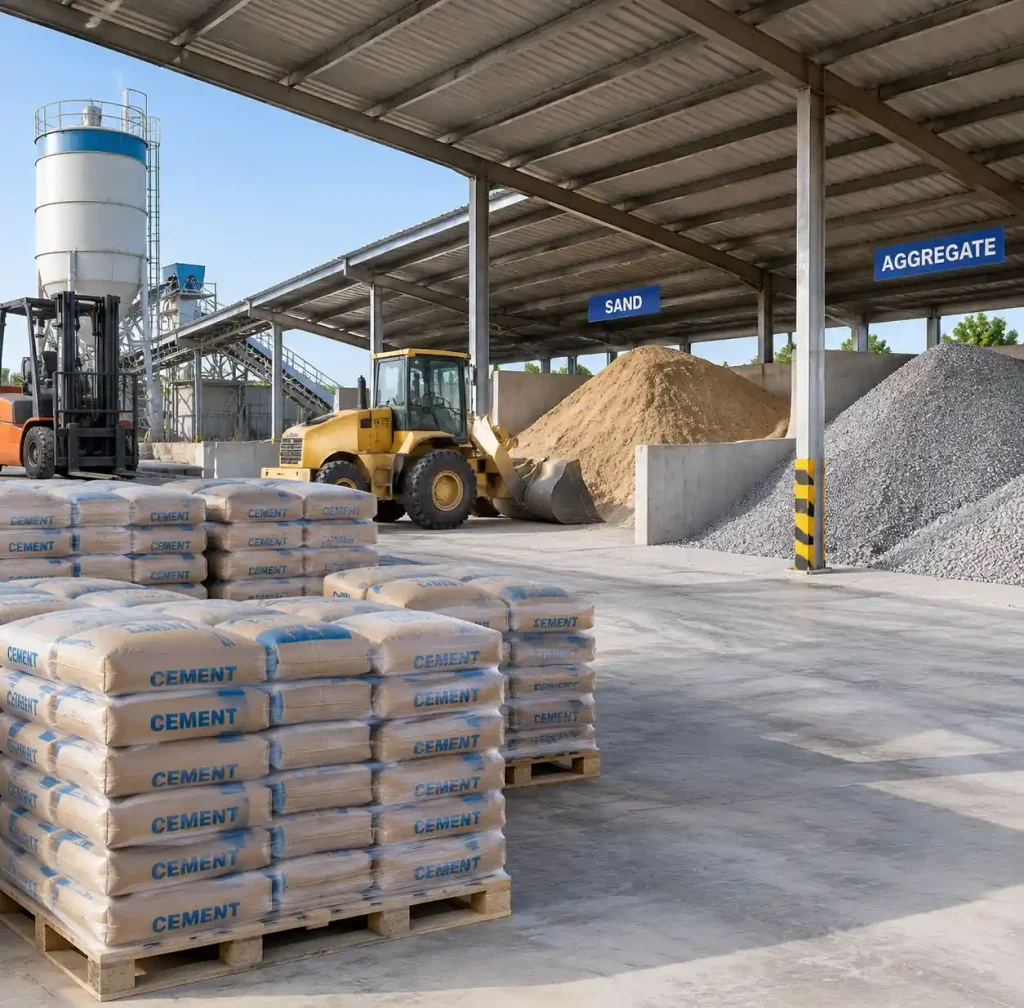
Raw Material Storage: 800-3,000 sq ft for cement (covered), aggregates, and sand (drainage required). Monthly inventory: 15-25% of projected monthly consumption.
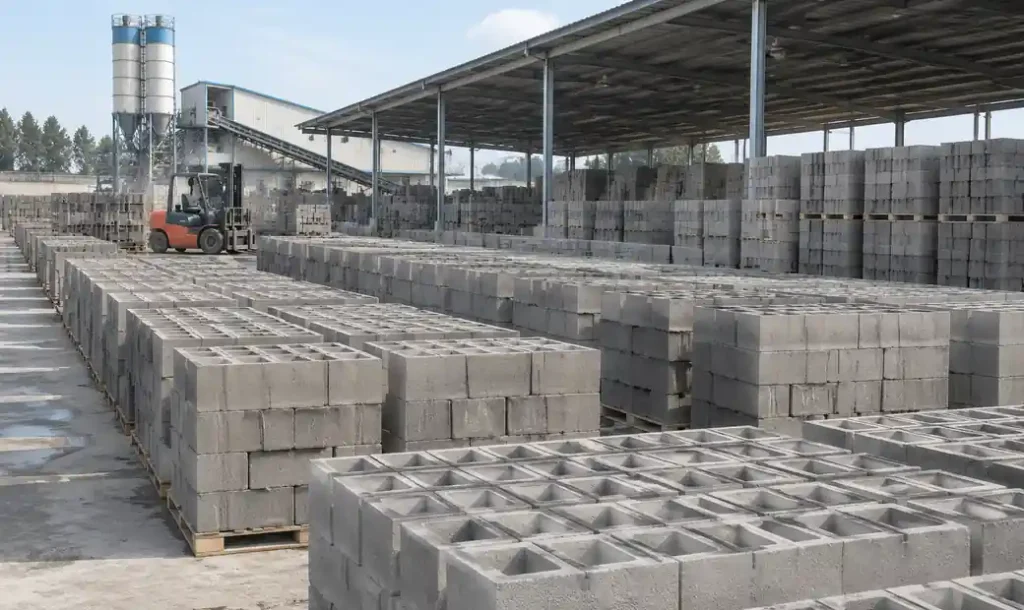
Finished Product Storage: 1,500-6,000 sq ft for order fulfillment and delivery staging, organized by block type and production date.
Our detailed space planning guide provides calculations for facilities producing 3,000-50,000 blocks daily.
Financial Projections and Capital Requirements
Startup Capital Breakdown
Block manufacturing startup costs range from $35,000 for basic manual operations to $380,000+ for fully automatic plants. According to equipment financing specialists, 60-70% of new operators require external financing to reach operational capacity.
| Expense Category | Manual Operation | Semi-Auto Operation | Automatic Plant |
|---|---|---|---|
| Core Equipment | $9,000-$15,000 | $18,000-$32,000 | $110,000-$185,000 |
| Equipos auxiliares | $4,500-$7,000 | $12,000-$18,000 | $35,000-$55,000 |
| Facility Setup | $8,000-$15,000 | $18,000-$28,000 | $45,000-$75,000 |
| Working Capital | $6,000-$10,000 | $15,000-$22,000 | $40,000-$65,000 |
| Total Investment | $27,500-$47,000 | $63,000-$100,000 | $230,000-$380,000 |
Working capital covers 60-90 days of raw materials, labor, utilities, and operating expenses before receivables convert to cash. Insufficient working capital—the primary cause of first-year failure in manufacturing—forces operators into high-cost short-term borrowing or prevents them from accepting large contracts requiring material purchases before payment.
Revenue Projections and Break-Even Analysis
Revenue projections must account for capacity ramp-up: new operations rarely exceed 40-50% capacity in months 1-3, reaching 60-70% by month 6 and 75-85% by year-end. Assume 25-28 production days monthly (accounting for weekends, maintenance, and material delays).
Example: Semi-Automatic Operation (2,400 blocks/day capacity)
- Month 1-3: 1,000 blocks/day × 25 days × $1.50 = $37,500/month
- Month 4-6: 1,500 blocks/day × 26 days × $1.50 = $58,500/month
- Month 7-12: 1,800 blocks/day × 26 days × $1.50 = $70,200/month
Year 1 revenue: $682,500 at 62% average capacity
Break-even occurs when monthly revenue covers fixed costs (equipment depreciation, facility rent, core labor, insurance) plus variable costs (raw materials, energy, consumables). For semi-automatic operations, break-even typically falls at 45-55% capacity utilization, reached in months 4-7 for operations with established contractor relationships or months 6-10 for those building customer base from zero.
Raw Material Sourcing and Cost Management
Material Specifications and Consumption Rates
Standard hollow blocks (400×200×200mm) require:
- Portland Cement: 2.0-2.4 kg per block at $0.14-$0.18/kg = $0.28-$0.43
- Aggregates (6-12mm): 8-10 kg at $0.012-$0.018/kg = $0.10-$0.18
- Sand (fine aggregate): 3-4 kg at $0.008-$0.014/kg = $0.02-$0.06
- Water: 1.2-1.6 liters (negligible cost)
Total material cost: $0.40-$0.67 per block. Understanding raw material quality specifications directly impacts block strength, surface finish, and production consistency.
Supplier Relationship Management
Cement typically represents 55-65% of raw material costs, making supplier terms critical. Volume purchasers (10+ tons monthly) negotiate 8-12% discounts off retail pricing and 30-45 day payment terms. Aggregate and sand sourcing from local quarries reduces transport costs 25-40% versus wholesale building material distributors.
Maintain relationships with 2-3 suppliers per material category—single-source dependency creates vulnerability to supply interruptions, price increases, or quality inconsistencies that halt production and damage customer relationships.
Marketing and Sales Strategy
Customer Acquisition Channels
Block sales operate primarily through direct relationships rather than retail marketing. Effective customer acquisition focuses on:
Contractor Direct Outreach: Visit active construction sites during early foundation or wall-building phases, offering samples and pricing. Contractors switching suppliers mid-project is rare; timing initial contact with project starts increases conversion rates.
Building Material Retailers: Supply agreements with local lumber yards and masonry supply stores provide consistent volume but reduce margins 12-18% through wholesale pricing.
Government Bid Participation: Municipal housing projects and infrastructure contracts require pre-qualification (business registration, insurance certificates, sample testing results) but provide 50,000-200,000+ block orders.
Industry Associations: Membership in local builder associations, chamber of commerce, or construction trade groups provides networking opportunities and establishes credibility with larger contractors.
Competitive Differentiation Strategy
In commodity markets, sustainable competitive advantage requires operational excellence in one of three areas:
Quality Consistency: Tighter mix ratios, calibrated equipment, and systematic curing produce blocks with ±3% dimensional tolerance and 18-22 MPa compressive strength versus industry standards of ±5% tolerance and 17-20 MPa. Premium pricing of 8-12% becomes achievable for commercial contractors requiring structural compliance.
Delivery Reliability: Maintaining 95%+ on-time delivery through adequate curing inventory (10-14 days production backlog) and dedicated delivery vehicle converts contractors frustrated with competitors’ delays.
Cost Leadership: Automatic production reducing labor costs to $0.018-$0.038/block enables 15-20% price undercutting while maintaining margins, capturing volume-sensitive segments.
Financial Projections: 3-Year Pro Forma
Year 1 Conservative Scenario (Semi-Automatic, 2,400 blocks/day capacity)
| Quarter | Avg Daily Production | Days Operated | Revenue | COGS | Gross Profit | Operating Expenses | Net Income |
|---|---|---|---|---|---|---|---|
| Q1 | 1,000 | 75 | $112,500 | $56,250 | $56,250 | $48,000 | $8,250 |
| Q2 | 1,500 | 78 | $175,500 | $87,750 | $87,750 | $51,000 | $36,750 |
| Q3 | 1,800 | 78 | $210,600 | $105,300 | $105,300 | $52,500 | $52,800 |
| Q4 | 1,800 | 75 | $202,500 | $101,250 | $101,250 | $54,000 | $47,250 |
| Total | — | 306 | $701,100 | $350,550 | $350,550 | $205,500 | $145,050 |
3-Year Revenue Trajectory
- Year 1: $701,100 (62% capacity) — Break-even Q2, positive cash flow Q3
- Year 2: $1,123,200 (75% capacity) — Established customer base, improved efficiency
- Year 3: $1,404,000 (85% capacity) — Market penetration approaching sustainable ceiling
These projections assume 50% gross margin (materials at $0.55, selling at $1.50), 25-28 production days monthly, and operating expenses (rent, utilities, insurance, non-production labor) of $17,000-$18,500 monthly.
Risk Analysis and Mitigation Strategies
Operational Risks
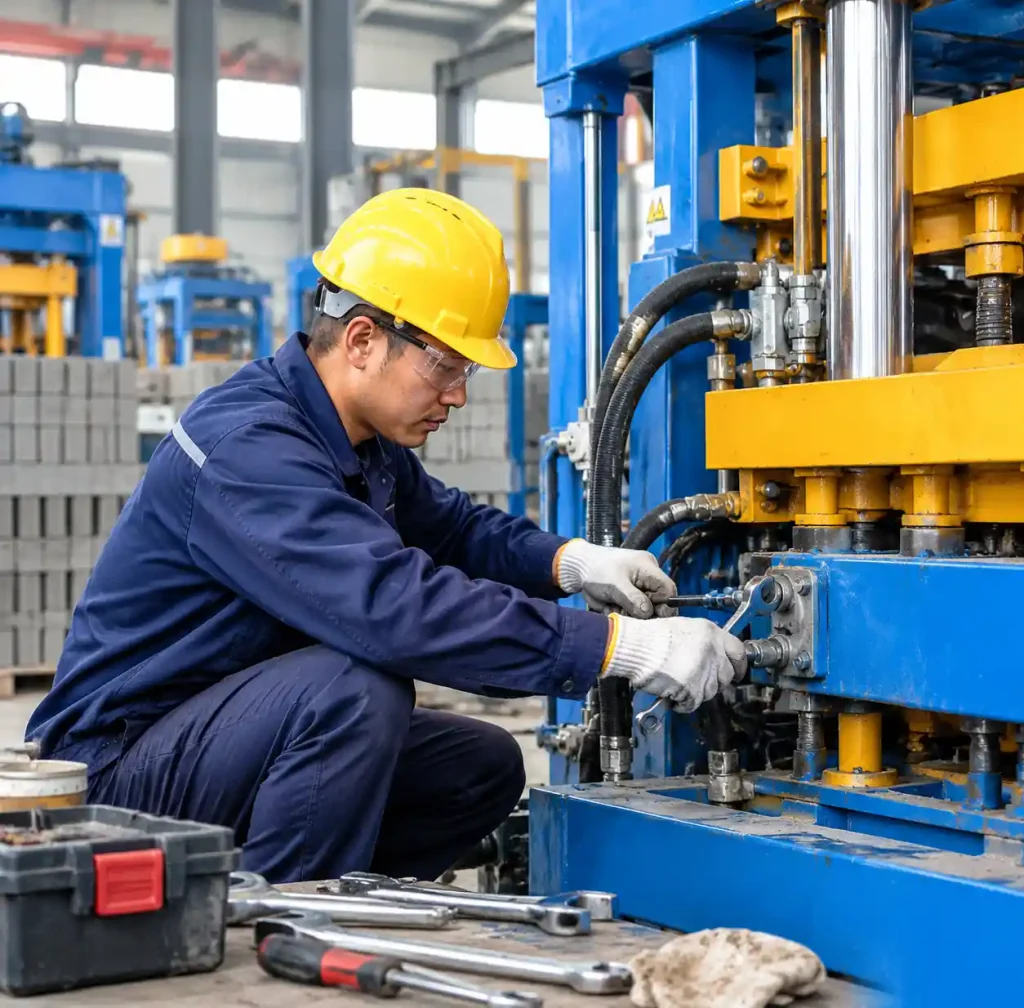
Equipment Failure: Hydraulic systems, vibration motors, and molds require scheduled maintenance every 500-1,000 operating hours. Spare parts inventory ($3,000-$8,000) prevents 3-7 day shutdowns when components fail. Extended equipment downtime at 70% capacity costs $2,800-$4,200 in lost contribution margin daily.
Quality Control Failures: Blocks failing strength tests damage reputation irreparably. Systematic quality control procedures—mix ratio verification, regular strength testing, dimensional inspection—prevent defect rates exceeding 2-3%.
Raw Material Price Volatility: Cement prices fluctuate 15-25% annually with oil prices and regional supply. Fixed-price contracts without material escalation clauses expose producers to margin compression during price spikes.
Financial Risks
Working Capital Constraints: Block manufacturing sells on 30-60 day terms while purchasing raw materials at 15-30 day terms, creating cash flow gaps. Equipment financing structures matching payment schedules to revenue cycles prevents working capital depletion.
Seasonal Demand Variation: Construction activity decreases 30-50% during winter months in cold climates or rainy seasons in tropical regions. Year-round operations require either diversified markets or adequate reserves to cover 2-3 months of reduced revenue.
Frequently Asked Questions
What is the minimum investment required to start block manufacturing?
Manual block production starts at $27,500-$47,000 including equipment, facility setup, and working capital. Semi-automatic operations require $63,000-$100,000, while fully automatic plants need $230,000-$380,000. Most operators secure equipment financing for 60-70% of machinery costs.
How long does it take to reach profitability in block manufacturing?
Break-even occurs at 45-55% capacity utilization, typically reached in months 4-10 depending on market entry strategy. Operations with pre-established contractor relationships or supply agreements break even by month 4-6; those building customer bases from zero require 8-12 months. Positive cash flow follows break-even by 1-2 months as working capital cycle stabilizes.
What profit margins can block manufacturers expect?
Gross margins range from 40-55% at optimal capacity (70-85%), with net margins of 18-28% after operating expenses. Manual operations achieve lower margins (18-22% net) due to higher labor costs, while automatic production reaches 25-32% through reduced per-unit costs.
What permits and licenses are required for block manufacturing?
Requirements vary by jurisdiction but typically include: business registration ($100-$800), general liability insurance ($1,200-$2,400/year), environmental permits for concrete dust management ($200-$1,500), and occasionally local manufacturing permits ($150-$800). Operations in industrial zones face fewer restrictions than those in mixed-use or residential areas.
How do I compete with established block manufacturers?
New entrants succeed by identifying specific market gaps: underserved geographic areas where transport costs create 15-20% price premiums, specialty products (interlocking blocks, architectural finishes) unavailable locally, or quality consistency problems creating contractor dissatisfaction with incumbents.
What is the typical ROI timeline for block manufacturing equipment?
Equipment ROI ranges from 12-24 months depending on automation level and capacity utilization. Semi-automatic machines typically recover investment in 14-18 months at 65-75% capacity; fully automatic plants require 18-24 months at 60-70% capacity due to higher initial investment.
Conclusión
Block manufacturing remains a viable business model for operators who approach it with realistic capital requirements, systematic production processes, and clear competitive positioning. The difference between operations that reach profitability within 12-18 months and those that struggle for years lies not in market conditions but in pre-launch planning—specifically, understanding production economics, customer acquisition timelines, and working capital management.
This business plan template provides the framework, but successful execution requires adapting these components to your specific market conditions: local construction growth rates, competitive landscape, and available financing options. Operators who quantify their opportunity, validate demand before equipment purchase, and maintain adequate working capital through the capacity ramp-up period build sustainable businesses capturing the ongoing infrastructure and housing construction driving block demand worldwide.
For equipment selection guidance, review our complete block machine comparison guide or consult with Raytone Block Machinery’s technical team for production capacity analysis specific to your target market.