





من المتوقع أن يصل حجم سوق قوالب البناء العالمية إلى $13.85 مليار بحلول عام 2034، مدفوعًا بتطوير البنية التحتية في منطقة آسيا والمحيط الهادئ وأفريقيا. لكن حجم السوق الإجمالي وحده لا يخبرك شيئًا عما إذا كانت شركتك المتخصصة في تصنيع قوالب البناء ستحقق أرباحًا بالفعل. فالربحية الحقيقية تعتمد على ثلاثة عوامل يمكن التحكم فيها: طريقة الإنتاج، وإمكانية الحصول على المواد الخام، ومدى ملاءمة طاقة الآلات للطلب المحلي.
يقدم هذا التحليل تفصيلاً لأرقام الإيرادات الفعلية، وهياكل التكاليف، والجداول الزمنية لعائد الاستثمار، استناداً إلى بيانات السوق لعام 2026 ونماذج الأعمال التي أثبتت فعاليتها. ستتعرف على هوامش الربح المتوقعة، والمدة اللازمة للوصول إلى نقطة التعادل، وحجم الإنتاج الذي يتناسب مع ميزانيتك وظروف السوق.
حجم الإنتاج والاستثمار الأولي
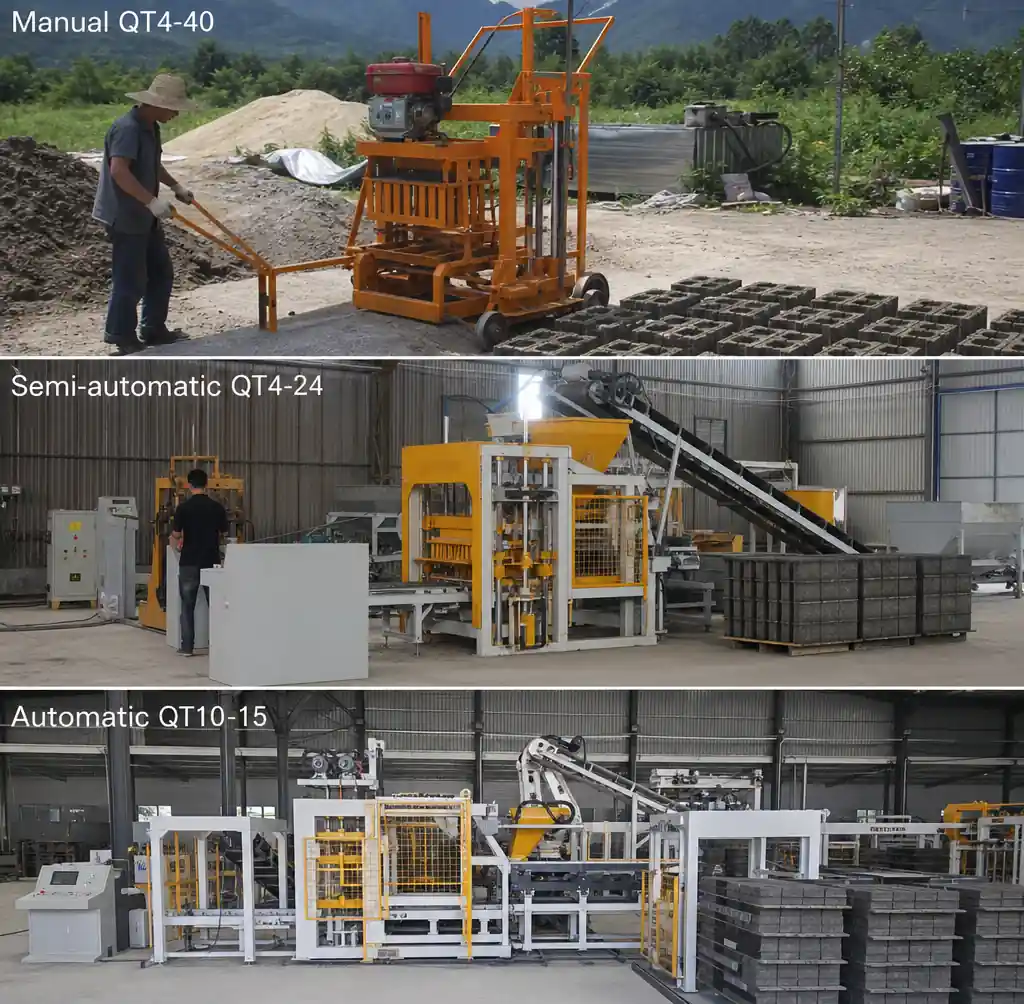
يُعد اختيار حجم الإنتاج المناسب أهم قرار على الإطلاق فيما يتعلق بالربحية. فالقدرة الإنتاجية الناقصة تؤدي إلى ضياع فرص تحقيق أرباح. أما القدرة الإنتاجية الزائدة فتقضي على هوامش الربح بسبب المعدات المعطلة والتكاليف الثابتة.
متطلبات الاستثمار حسب مستوى الإنتاج
| حجم الإنتاج | نوع الآلة | الاستثمار الأولي | السعة اليومية (400 × 200 × 200 مم) | العمالة المطلوبة |
|---|---|---|---|---|
| على نطاق صغير | آلة القطع اليدوية (QT4-40) | $8,000 – $15,000 | 2,500 – 4,000 كتلة | 4 عمال |
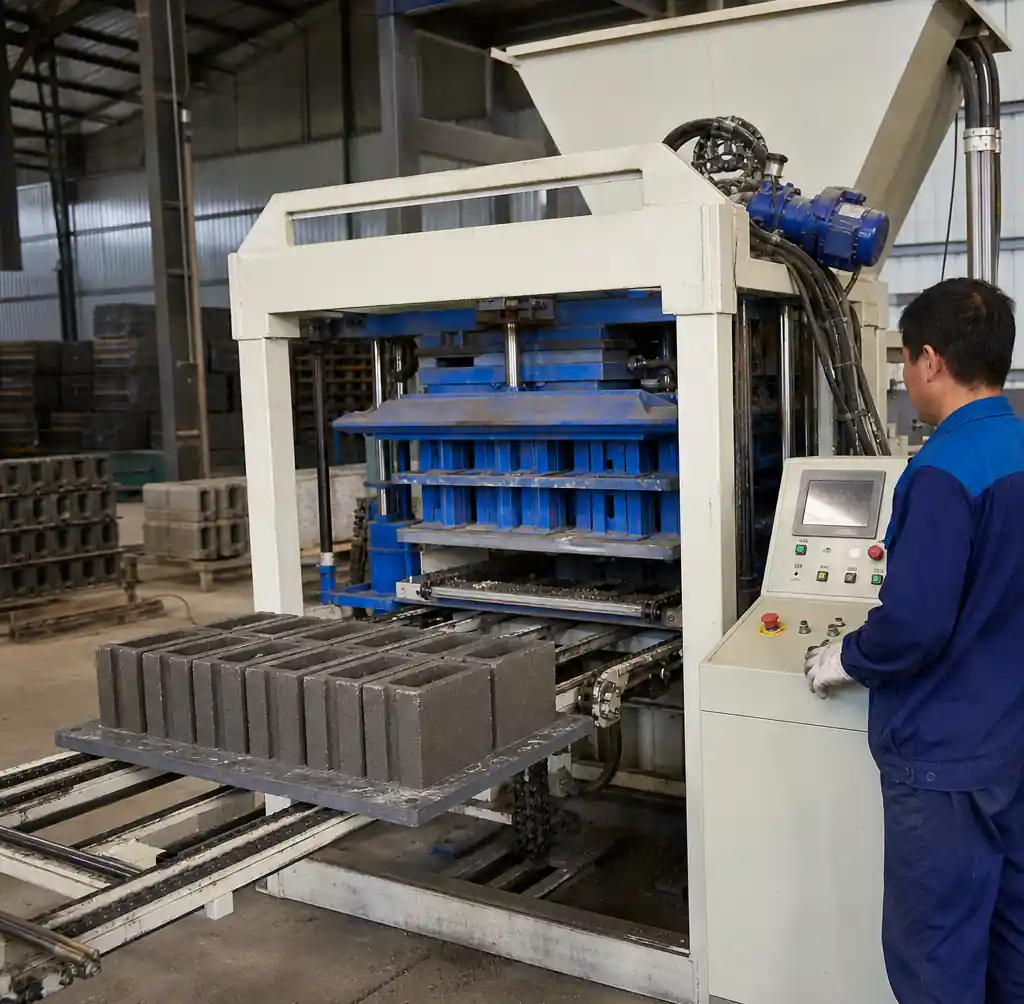
| متوسط الحجم | آلة شبه أوتوماتيكية (QT4-24) | $25,000 – $45,000 | 7,000 – 9,000 كتلة | 4 عمال |
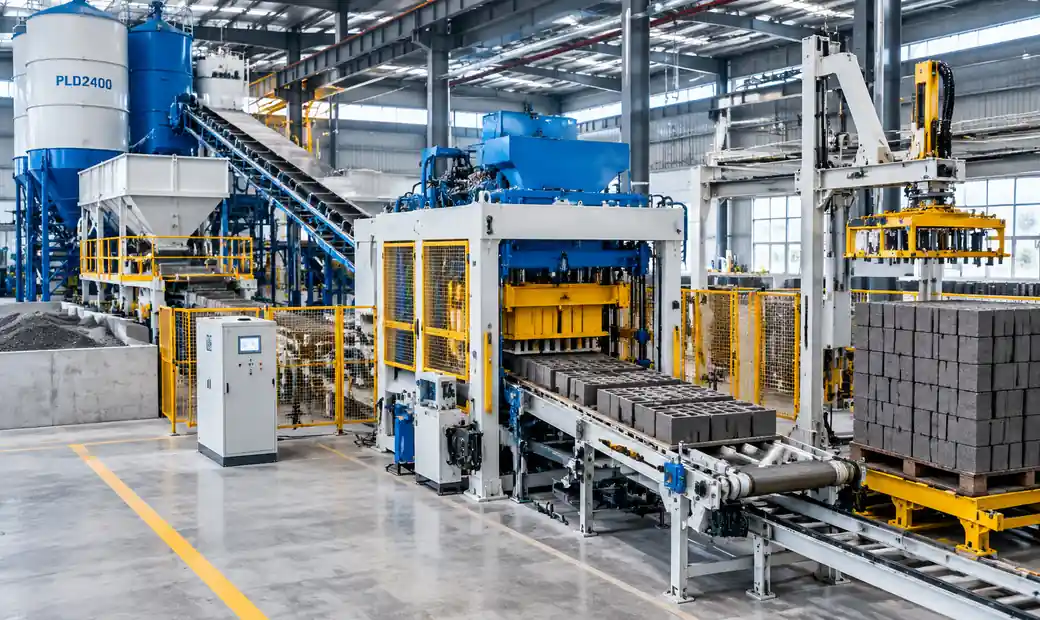
| على نطاق واسع | آلة تشكيل الكتل الأوتوماتيكية (QT10-15) | $85,000 – $150,000 | 30,000 – 46,000 كتلة | 5-7 عاملين |
تُعد الآلات اليدوية خيارًا مناسبًا للشركات الناشئة التي تختبر الطلب في السوق أو التي تعمل في مناطق تتميز بيد عاملة رخيصة وكهرباء باهظة الثمن. أما الأنظمة شبه الآلية، فهي توفر التوازن الأمثل بين التكلفة والكفاءة لمعظم الشركات — حيث تتطلب استثمارات رأسمالية أقل مقارنة بالأتمتة الكاملة، لكن إنتاجيتها تبلغ ثلاثة أضعاف إنتاجية التشغيل اليدوي.
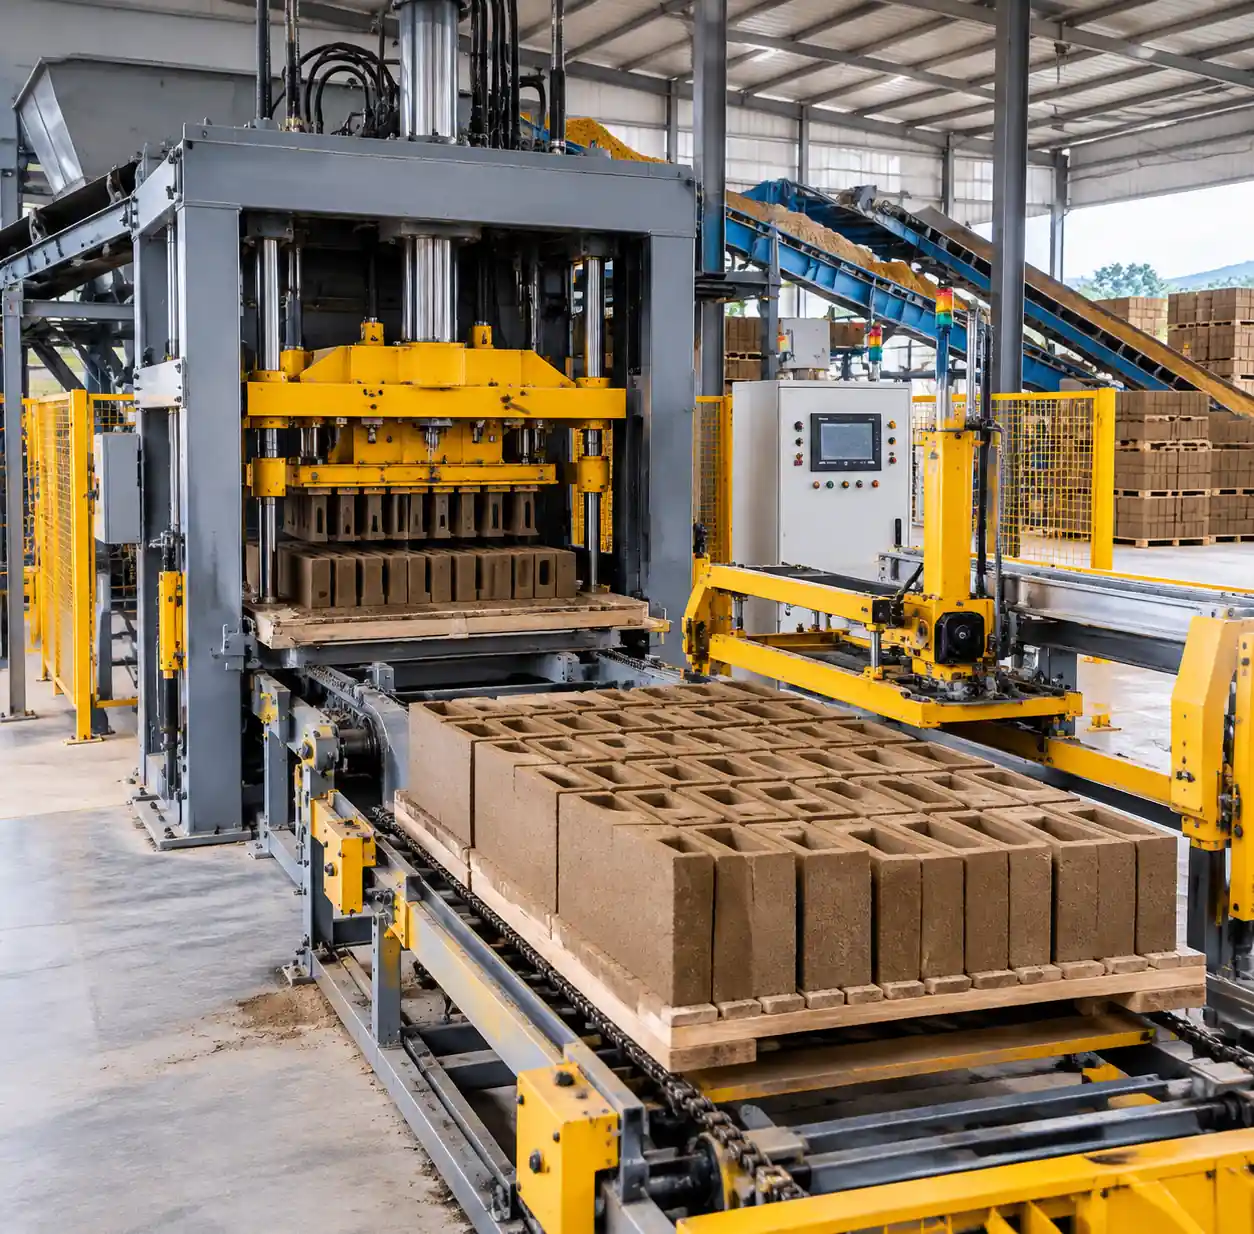
يكون استخدام الخطوط الآلية أمراً منطقياً عندما تكون لديك عقود طلب مؤكدة تتجاوز 500,000 بلوك شهرياً. إن النظام الأوتوماتيكي QT10-15 تنتج آلة «رايتون بلوك» (Raytone Block Machinery) 46,080 قطعة من الطوب المجوف في كل نوبة عمل مدتها 8 ساعات، مما يتيح تحقيق إيرادات تبرر الاستثمار الذي يصل إلى ستة أرقام في غضون 12 إلى 18 شهراً في الأسواق القوية.
توقعات الإيرادات وأسعار السوق
تختلف أسعار الكتل بشكل كبير حسب المنطقة ونوع الكتلة والمنافسة المحلية. إن فهم الحد الأقصى للأسعار في سوقك يحدد الحد الأقصى للإيرادات المحتملة قبل أن تستثمر دولارًا واحدًا.
التسعير الإقليمي على أساس الكتل لعام 2026
| المنطقة | كتلة مجوفة قياسية (400 × 200 × 200 مم) | كتلة رصف (200 × 100 × 60 مم) | كتلة صلبة (240 × 115 × 50 مم) |
|---|---|---|---|
| أفريقيا (الشرقية) | $0.35 – $0.65 | $0.45 – $0.75 | $0.25 – $0.40 |
| آسيا (جنوب شرق) | $0.30 – $0.55 | $0.40 – $0.70 | $0.20 – $0.35 |
| الشرق الأوسط | $0.45 – $0.85 | $0.55 – $0.95 | $0.30 – $0.50 |
| أفريقيا (الغربية) | $0.40 – $0.70 | $0.50 – $0.80 | $0.28 – $0.45 |
تنتج منشأة متوسطة الحجم تعمل بآلة شبه أوتوماتيكية من طراز QT4-24 بسعة 75% ما يقارب 5,500 كتلة يوميًا (165,000 شهريًا). وبمتوسط سعر بيع يبلغ $0.50 للكتلة الواحدة، تصل الإيرادات الشهرية إلى $82,500 قبل احتساب تنوع المنتجات والتغيرات الموسمية.
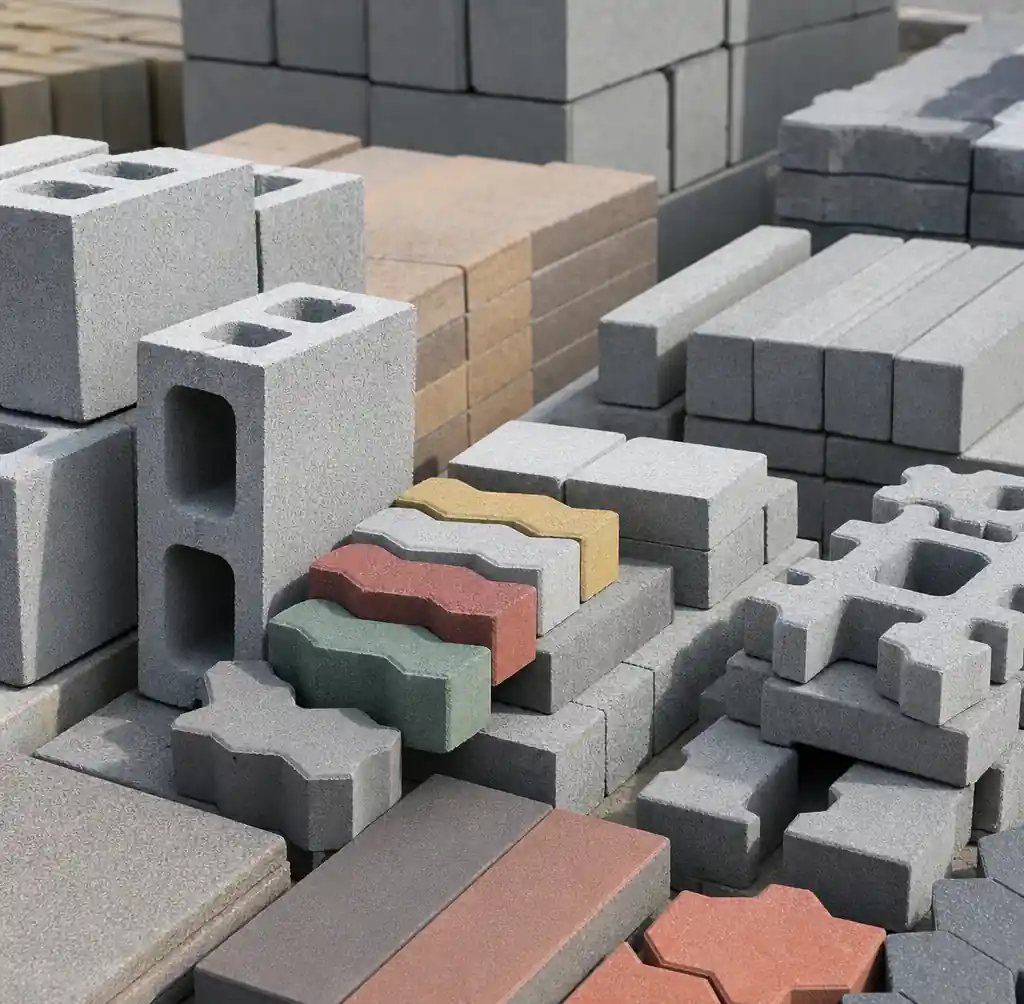
تحافظ الشركات الأكثر ربحية على مزيج منتجات بنسبة 60/30/10: كتل مجوفة قياسية من طراز 60% للأعمال الإنشائية العامة، و30% كتل الرصف لمشاريع تنسيق الحدائق ذات الهامش الربحي الأعلى، والكتل المخصصة أو الصلبة من طراز 10%. ويمكن أن يؤدي تحسين تركيبة الخلطة هذه إلى رفع متوسط سعر البيع بنسبة تتراوح بين 15 و20% مقارنةً بالإنتاج الذي يقتصر على الكتل المجوفة فقط.
تفصيل تكاليف التشغيل
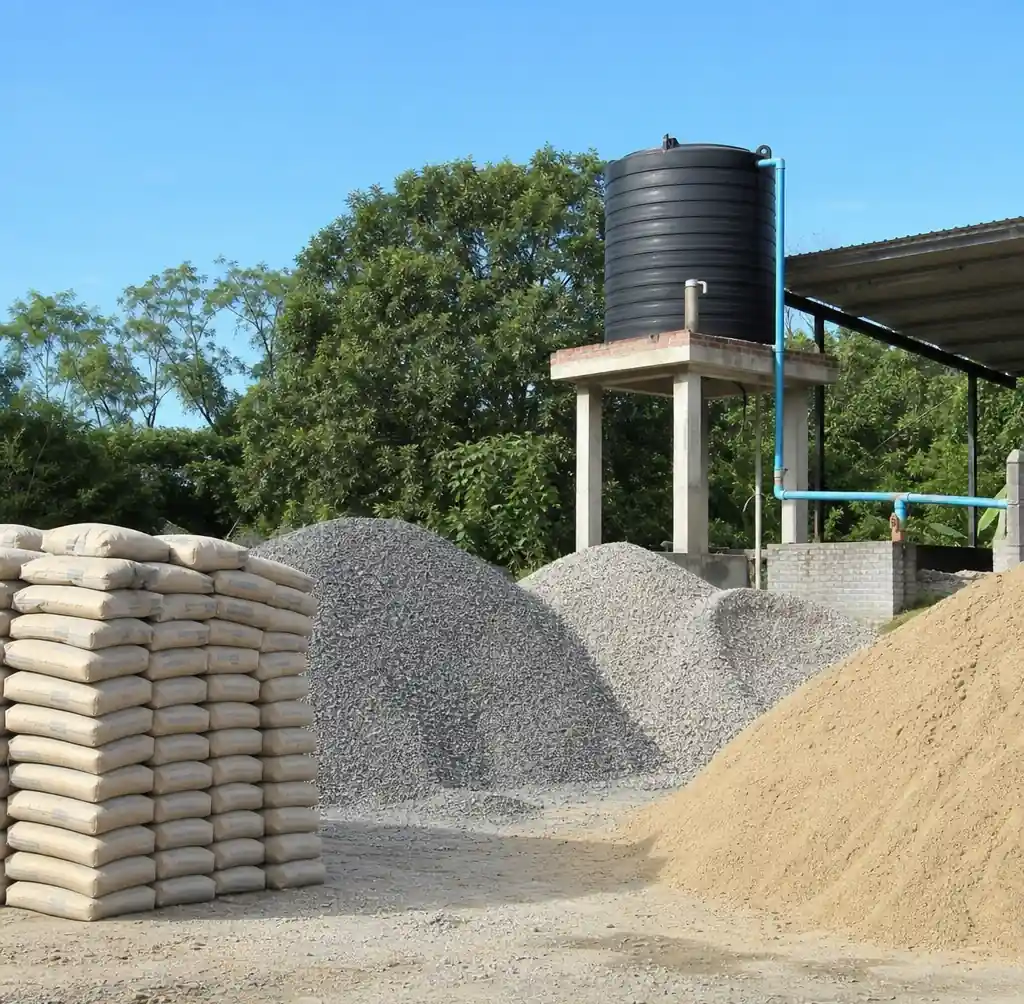
تكمن الربحية في الفارق بين سعر البيع وتكلفة الإنتاج. وتهيمن المواد الخام على هيكل التكاليف لديك — حيث تمثل المواد مثل الأسمنت والركام والرمل عادةً ما بين 55 و65% من إجمالي النفقات التشغيلية.
هيكل التكلفة لكل كتلة (400 × 200 × 200 مم)
| فئة التكلفة | الإنتاج اليدوي | الإنتاج شبه الآلي | إنتاج السيارات | ملاحظات بشأن التكلفة |
|---|---|---|---|---|
| المواد الخام | $0.18 – $0.25 | $0.16 – $0.22 | $0.15 – $0.20 | الأسمنت، الرمل، الركام |
| العمل | $0.08 – $0.12 | $0.04 – $0.06 | $0.02 – $0.03 | التخصيص لكل كتلة |
| المرافق العامة | $0.03 – $0.05 | $0.03 – $0.04 | $0.04 – $0.06 | الكهرباء/الديزل |
| الصيانة | $0.01 – $0.02 | $0.02 – $0.03 | $0.03 – $0.04 | صيانة المعدات |
| التكلفة الإجمالية | $0.30 – $0.44 | $0.25 – $0.35 | $0.24 – $0.33 | لكل كتلة |
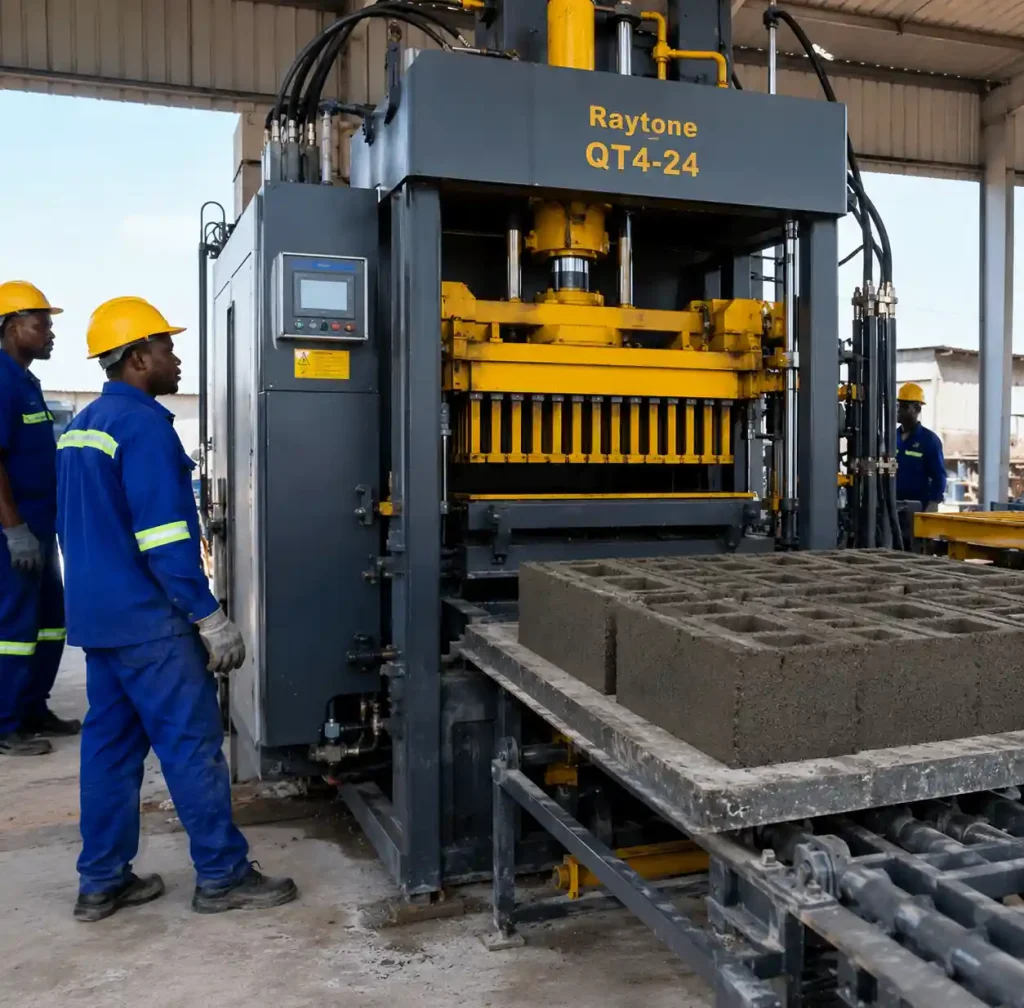
يوفر الإنتاج شبه الآلي أفضل كفاءة من حيث التكلفة، حيث إن التوفير في العمالة يعوض الزيادة الطفيفة في تكاليف المرافق والصيانة مقارنة بالتشغيل اليدوي. تنتج آلة QT4-24 الكتل بتكلفة متوسطة تبلغ $0.28 في ظل عمليات مُحسَّنة، مما يحقق ربحًا إجماليًّا قدره $0.22 لكل كتلة عند بيعها بسعر $0.50.
تتناسب تكاليف العمالة عكسياً مع مستوى الأتمتة. تتطلب العملية اليدوية 4 عمال ينتجون 3,000 كتلة يومياً (بتكلفة عمالة تبلغ $0.10 لكل كتلة، وبأجر يومي قدره $30). أما نفس العمال الأربعة على خط إنتاج شبه آلي، فينتجون 8,000 كتلة (بتكلفة عمالة تبلغ $0.04 لكل كتلة). وتنخفض التكلفة في خطوط الإنتاج الآلية إلى ما بين $0.02 و$0.03 لكل كتلة، لكنها تتطلب مشغلين ماهرين.
تختلف تكاليف المواد الخام باختلاف سلاسل التوريد المحلية. وتتقلب أسعار الأسمنت بنسبة تتراوح بين 20 و30% سنويًّا. وتوفر الشركات الواقعة في نطاق 50 كيلومترًا من محاجر الركام ما بين $0.02 و$0.04 لكل كتلة من حيث تكاليف النقل. وتتضاعف فائدة هذا القرب مع إنتاج ملايين الكتل سنويًّا.
تحليل نقطة التعادل والجدول الزمني لعائد الاستثمار
يحدد توقيت بلوغ نقطة التعادل ما إذا كان مشروعك سيتجاوز مرحلة البدء أم لا. فمعظم مشاريع صناعة الطوب تفشل ليس بسبب ضعف الطلب في السوق، بل بسبب نفاد رأس المال قبل بلوغ التدفق النقدي الإيجابي.
الجدول الزمني للوصول إلى نقطة التعادل حسب الحجم
توضح العملية شبه الآلية ديناميكيات التدفق النقدي النموذجية. الاستثمار الأولي: آلة بقيمة $35,000 + معدات داعمة بقيمة $15,000 (خلاط الخرسانة, ، المنصات، القوالب) + $10,000 رأس المال العامل = $60,000 الإجمالي.
الإنتاج الشهري عند طاقة 75%: 165,000 كتلة
متوسط سعر البيع: $0.50
الإيرادات الشهرية: $82,500
التكاليف التشغيلية الشهرية: $46,200 (المواد $36,300 + العمالة $4,800 + المرافق $3,600 + الصيانة $1,500)
الربح الإجمالي الشهري: $36,300
التكاليف الثابتة (الإيجار، المصاريف الإدارية، الاستهلاك): $8,000 شهريًّا
صافي الربح الشهري: $28,300
نقطة التعادل: $60,000 ÷ $28,300 = 2.1 شهر
يفترض هذا السيناريو تحقيق معدل استغلال يبلغ 75% ووجود طلب ثابت — وهو الوضع الذي تحققه معظم العمليات الراسخة في غضون 6 إلى 12 شهراً من بدء التشغيل. وعادةً ما تتراوح السعة في الأشهر الأولى بين 40 و50% أثناء بناء العلاقات مع العملاء وتحسين الإنتاج، مما يؤدي إلى تمديد فترة الوصول إلى نقطة التعادل الفعلية إلى 4 إلى 6 أشهر.
تستغرق الخطوط الآلية ما بين 8 و14 شهراً لتحقيق التعادل المالي بسبب ارتفاع تكاليف رأس المال، لكنها تحقق أرباحاً متزايدة بشكل كبير بعد ذلك. تُحقق آلة QT10-15 التي تنتج 40,000 كتلة يوميًا بتكلفة $0.26 وسعر بيع $0.50 ربحًا إجماليًّا شهريًّا قدره $288,000، مما يتيح استرداد استثمار الجهاز البالغ $120,000 خلال 5 أشهر من التشغيل بكامل طاقته الإنتاجية.
استراتيجيات تحسين هامش الربح
يحقق المشغلون الأذكياء هوامش ربح صافية تتراوح بين 35 و45%، في حين يعاني المنافسون من هوامش تتراوح بين 15 و20%. ويكمن الفرق في أربعة قرارات تشغيلية تتراكم آثارها عبر ملايين الكتل.
تنويع مزيج المنتجات
تحقق الكتل المجوفة القياسية هوامش ربح تتراوح بين 30 و35%. كتل الرصف تبلغ هوامش الربح في مجال تصميم الحدائق ما بين 40 و50%، لأن العملاء يدفعون مقابل الجمال والمتانة. أما الكتل المتشابكة المستخدمة في الجدران الاستنادية، فتصل هوامش ربحها إلى ما بين 45 و55%، وذلك بسبب تكاليف القوالب المتخصصة التي يتجنبها المنافسون.
تتوافق آلات «رايتون» مثل طراز QT4-24 مع مجموعات قوالب متعددة، مما يتيح التبديل بين المنتجات في نفس اليوم. حيث يقوم المشغلون بإنتاج الكتل المجوفة من الاثنين إلى الخميس لمقاولي البناء، ثم يتحولون إلى إنتاج كتل الرصف من الجمعة إلى السبت لتلبية الطلب في متاجر التجزئة خلال عطلة نهاية الأسبوع. وتؤدي هذه المرونة إلى زيادة متوسط سعر البيع 18% دون الحاجة إلى إضافة معدات.
مراقبة تكاليف المواد الخام
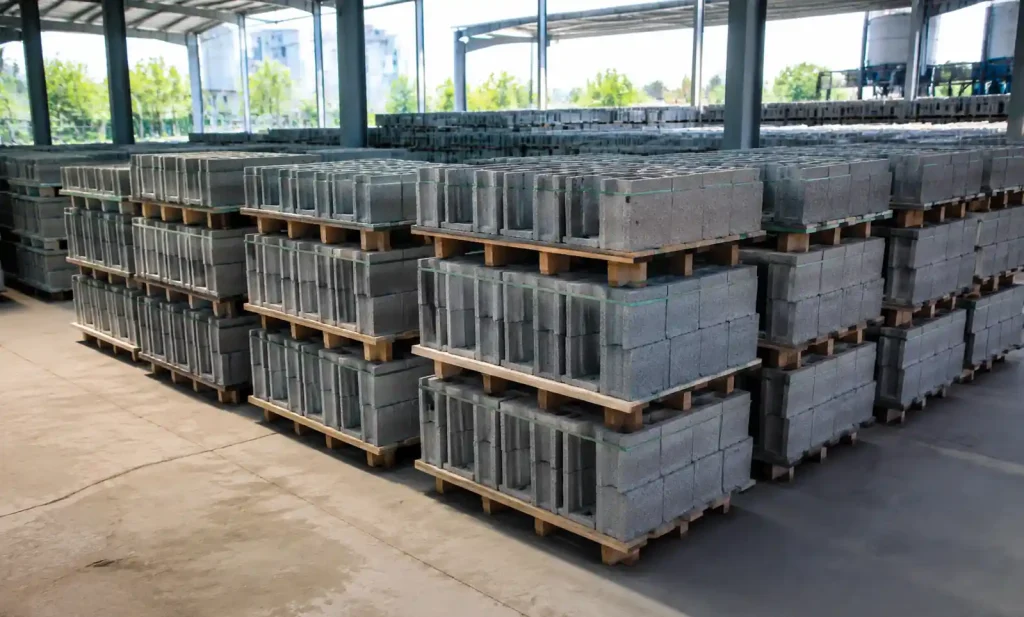
يمثل الأسمنت 40% من تكاليف المواد. ويؤدي الشراء بالجملة (40+ طنًا) إلى توفير 8-12% مقارنةً بالشراء بالأكياس. كما أن إقامة علاقات مباشرة مع المحاجر للحصول على الركام يقلل التكاليف بنسبة 15-20% مقارنةً بالموردين الخارجيين. تتراكم مزايا الشراء هذه لتصل إلى $0.03-$0.05 لكل كتلة — وبناءً على إنتاج 200,000 كتلة شهريًّا، فإن ذلك يمثل ربحًا إضافيًّا يتراوح بين $6,000 و$10,000.
التخطيط الموسمي أمر مهم. تنخفض أسعار الأسمنت بنسبة تتراوح بين 10 و15% خلال موسم الأمطار بسبب انخفاض الطلب. ويقوم المشغلون الأذكياء بتخزين مخزون من الأسمنت يكفي لمدة 2-3 أشهر عندما تصل الأسعار إلى أدنى مستوياتها، مما يضمن لهم مزايا تكلفية خلال موسم البناء المزدحم.
الحد من النفايات
إن الحفاظ على معدل النفايات أقل من 3% هو ما يميز العمليات المربحة عن العمليات الهامشية. وتشمل المصادر الشائعة للنفايات نسب الخلط غير الصحيحة (التي تؤدي إلى إنتاج كتل ضعيفة يرفضها العملاء)، وتلف القوالب الناتج عن سوء الصيانة، والكسر أثناء المعالجة والنقل.
تستخدم الآلات شبه الأوتوماتيكية مثل طراز QT4-30 ضغطًا هيدروليكيًا واهتزازًا ثابتين، مما ينتج عنه كتل أكثر اتساقًا مقارنةً بالعمليات اليدوية التي تتفاوت فيها الجودة حسب درجة إجهاد العامل. ويؤدي هذا الاتساق إلى خفض معدلات الرفض من 8-12% في العمليات اليدوية إلى 2-4% في الإنتاج شبه الأوتوماتيكي.
الطلب الموسمي وإدارة التدفقات النقدية
تُعد أنشطة البناء المحرك الرئيسي للطلب على الطوب، وتتأثر أعمال البناء بأنماط الطقس ودورات المشاريع. إن فهم هذه الإيقاعات يمنع حدوث أزمات التدفق النقدي التي قد تقضي على شركات كانت لتكون مربحة لولا ذلك.
تشهد معظم المناطق حجم أعمال بناء سنوي يتراوح بين 60 و70% خلال 6 إلى 8 أشهر من موسم الجفاف. ويؤدي ذلك إلى تقلبات في الإيرادات بين فترات الذروة والركود، مما يضع ضغوطًا على رأس المال العامل إذا لم يتم التخطيط لها مسبقًا. ويحتفظ المشغلون الناجحون باحتياطي يكفي لتغطية نفقات التشغيل لمدة 3 أشهر لتجاوز فترة الركود.
خيارات الاستراتيجيات الموسمية
الخيار 1: توسيع نطاق الإنتاج وفقًا للطلب — التشغيل بسعة 90% خلال موسم الذروة (6 أشهر)، و40% خلال موسم الركود (6 أشهر). يقلل ذلك من تكاليف المرافق وتآكل المعدات، لكنه يتطلب الاحتفاظ بالعمالة الماهرة خلال فترات الركود.
الخيار 2: تكوين المخزون — الحفاظ على إنتاج طراز 70% على مدار العام، مع تكوين مخزون خلال الموسم الهادئ استعدادًا لذروة الطلب. ويتطلب ذلك مساحة تخزين (1,000 متر مربع لمخزون يبلغ 200,000 قطعة) ورأس مال عامل لشراء المواد، ولكنه يتيح الاستفادة من علاوات الأسعار في موسم الذروة عندما تنفد مخزونات المنافسين.
الخيار 3: تنويع المنتجات — إنتاج كتل البناء خلال موسم البناء، والتحول إلى إنتاج كتل الرصف ومنتجات تنسيق الحدائق خلال موسم الركود. تلبية احتياجات شرائح مختلفة من العملاء تتمتع بطلب إجمالي أكثر استقرارًا.
التنويع الجغرافي يثبت فعاليته في العمليات الكبيرة. فموسم الأمطار يضرب مناطق مختلفة في أوقات مختلفة — فالموسم الهادئ في شرق إفريقيا هو موسم الذروة في غرب إفريقيا. والشركات التي آلات صب الخرسانة المتنقلة يمكنها نقل الإنتاج لتلبية الطلب، على الرغم من أن ذلك يزيد من تعقيدات العمليات اللوجستية.
حواجز دخول السوق والموقع التنافسي
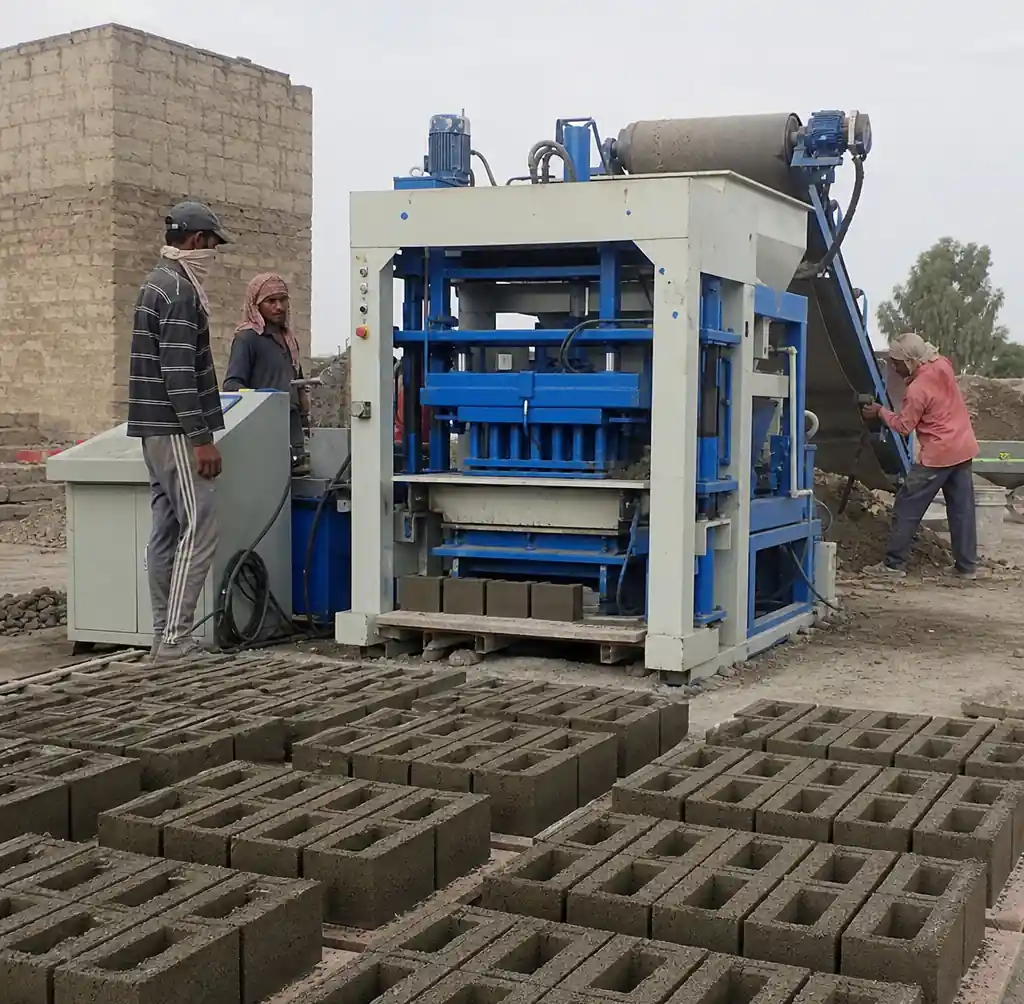
تتميز صناعة الكتل بانخفاض حواجز الدخول، مما يعني أن المنافسة هي التي تحدد ربحيتك الفعلية أكثر من الهوامش النظرية. وهناك ثلاثة عوامل تساهم في تكوين مراكز سوقية قوية.
1. الموقع واللوجستيات
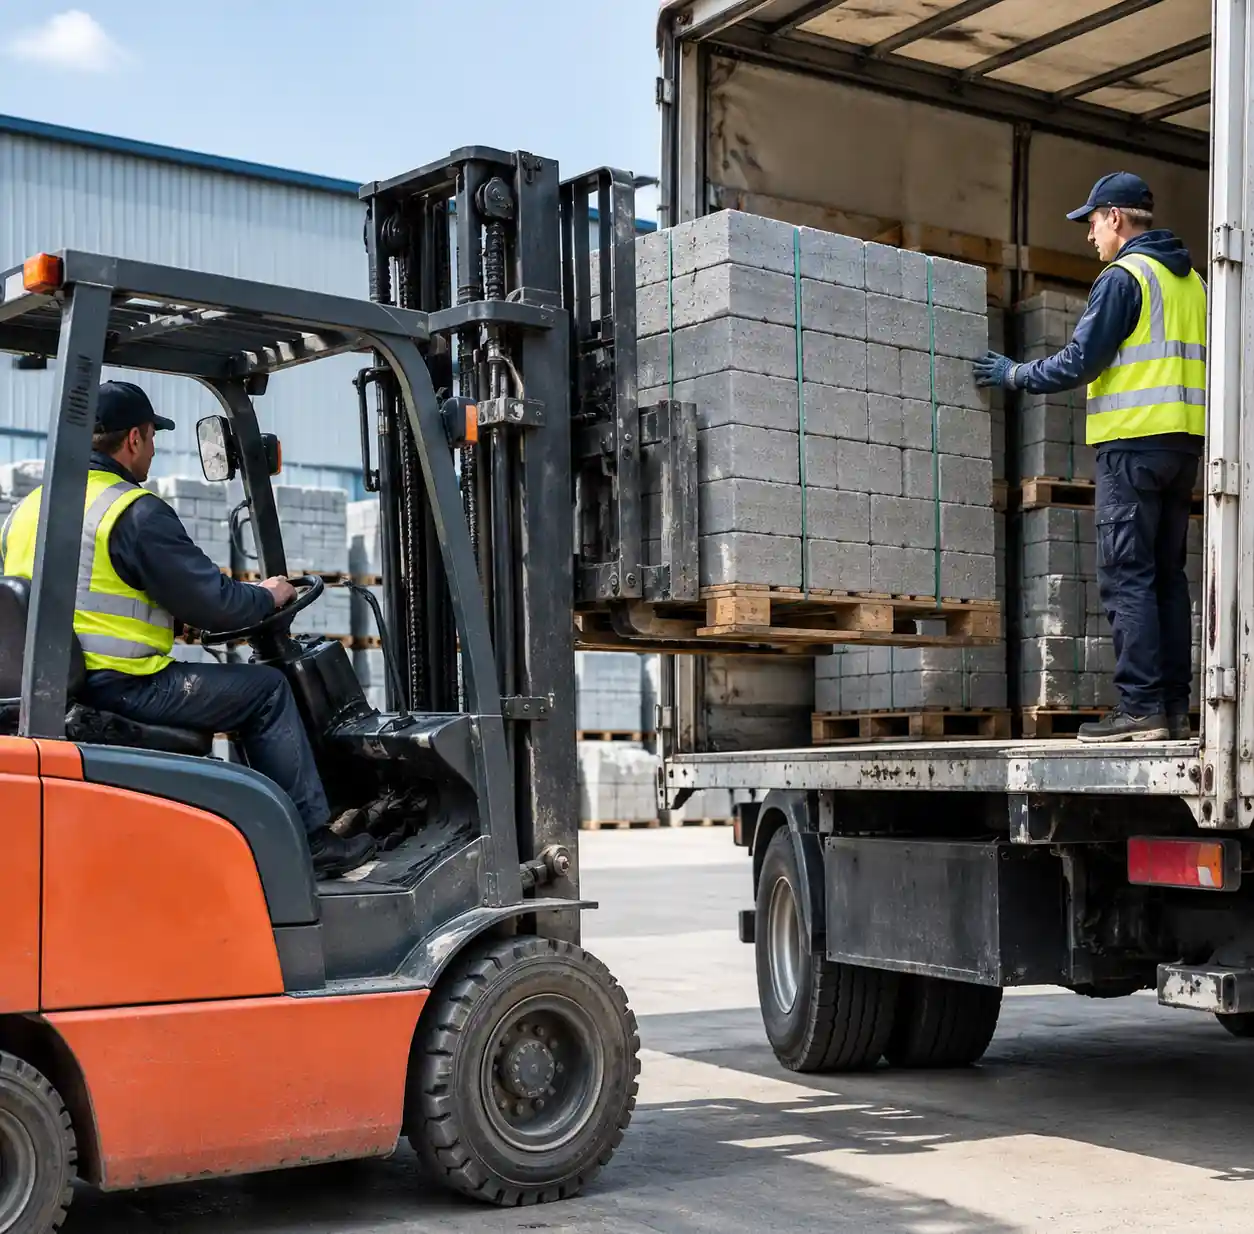
تبلغ تكاليف النقل $0.05-$0.08 لكل كتلة لكل 50 كم. الكتل هي منتجات ثقيلة ومنخفضة القيمة، حيث تؤدي تكاليف النقل إلى تآكل هوامش الربح خارج نطاق يبلغ 50-75 كم. ويؤدي تأمين مساحة إنتاجية على بعد 30 كم من مناطق البناء الرئيسية إلى خلق حاجز تكلفة لا يمكن للمنافسين تجاوزه دون التواجد في موقع قريب مماثل.
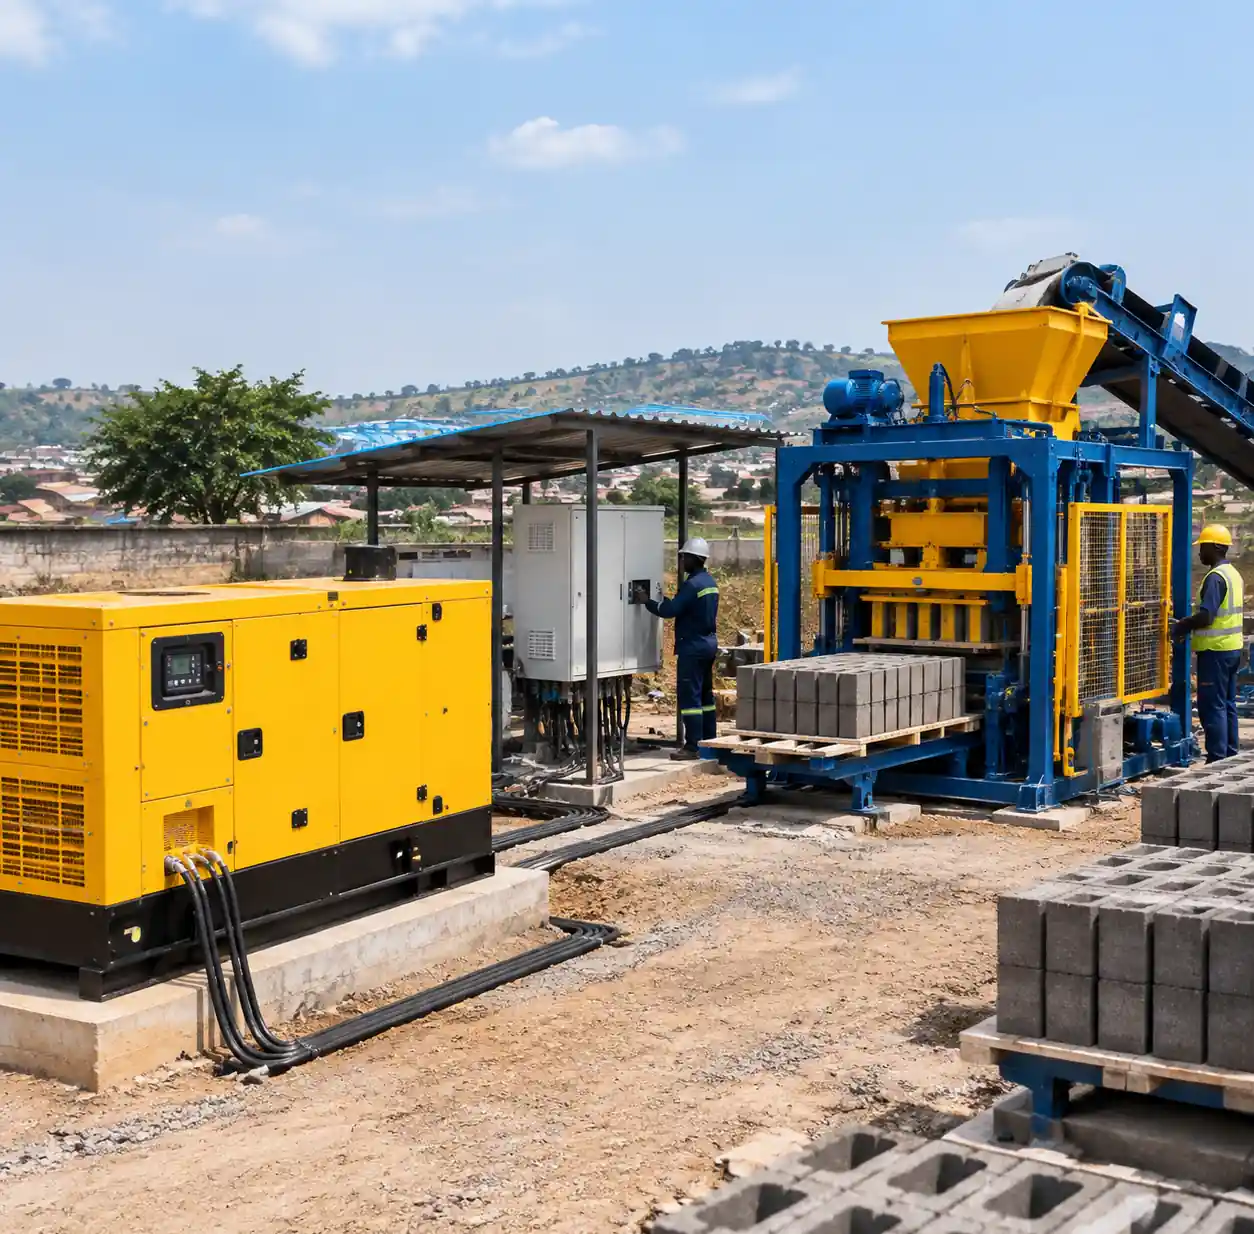
محطات تصنيع الخرسانة المتنقلة تتيح لك الإعداد في الموقع للمشاريع الكبيرة (أكثر من 500,000 كتلة)، مما يلغي تكاليف النقل تمامًا. ويدفع المقاولون أسعارًا أعلى ($0.05-$0.10 لكل كتلة) مقابل الإنتاج في الموقع لأن ذلك يقلل من تكاليف النقل والكسر.
2. اتساق الجودة والعلاقات
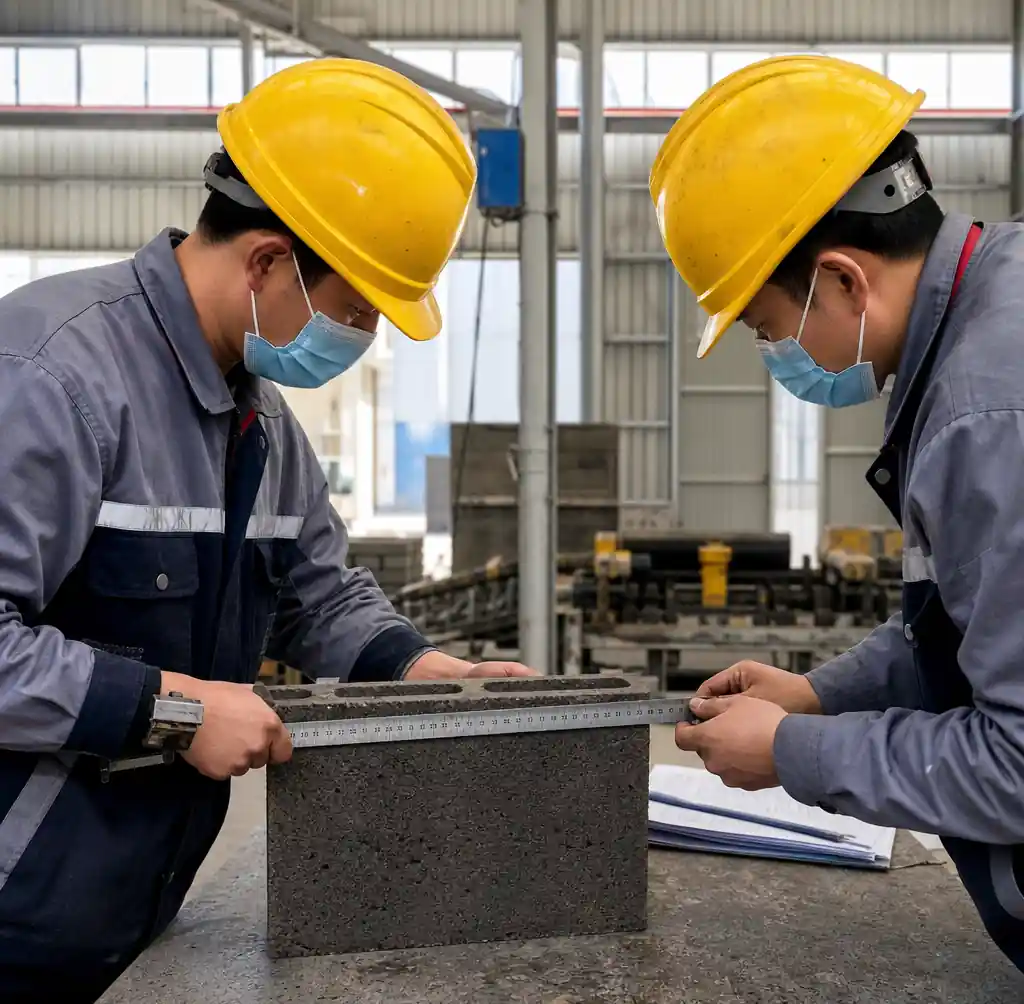
يحتاج مقاولو البناء إلى إمدادات موثوقة من الطوب بجودة ثابتة. فالتأخر في التسليم أو شحن طوب رديء لا يجتاز الفحص يكلف المقاولين أكثر بكثير من سعر الطوب نفسه. أما المشغلون الذين لا يتأخرون أبدًا في التسليم ويحافظون على معدلات رفض أقل من 2%، فيبنون قاعدة عملاء أوفياء قادرة على الصمود أمام المنافسة السعرية.
شبه آلية و خطوط الإنتاج الآلية وتوفر هذه الآلات هذا التناسق بشكل أفضل من العمليات اليدوية. تنتج الآلة الأوتوماتيكية QT8-15 ما مجموعه 30,720 كتلة في كل وردية عمل، مع ضغط وتصلب متماثلين، مما يفي بمواصفات ASTM C90 دون أي تباين.
3. مجموعة المنتجات والدعم الفني
تقتصر معظم الشركات الصغيرة على إنتاج الكتل المجوفة القياسية فقط. وتؤدي زيادة الطاقة الإنتاجية لتشمل أحجار الرصف والكتل الصلبة والتصاميم المتشابكة إلى توسيع نطاق السوق المستهدف وتقليل الاعتماد على شريحة عملاء واحدة. ويتطلب ذلك الاستثمار في مجموعات قوالب متعددة ($2,000-$5,000 لكل قالب)، لكنه يزيد من العائد لكل علاقة مع العملاء.
الأداء المالي: التوقعات للسنوات 1-3
يُظهر الأداء الفعلي للأعمال خلال السنوات الثلاث الأولى كيف تتطور الربحية مع نضوج العمليات وتوسع نطاقها.
المسار المالي للعمليات متوسطة الحجم (نظام QT4-24 شبه الأوتوماتيكي)
السنة الأولى
- الأشهر 1-3: زيادة الطاقة الإنتاجية لـ 50%، وبناء قاعدة عملاء
- الأشهر من 4 إلى 12: السعة المتوسطة 70%
- الإنتاج السنوي: 1.35 مليون كتلة
- الإيرادات: $675,000
- تكاليف التشغيل: $405,000
- التكاليف الثابتة: $96,000
- صافي الربح: $174,000 (هامش 26%)
- عائد الاستثمار (ROI): 290% على استثمار بقيمة $60,000
السنة الثانية
- 85% السعة المتوسطة مع قاعدة عملاء راسخة
- الإنتاج السنوي: 2.04 مليون كتلة
- الإيرادات: $1,020,000
- تكاليف التشغيل: $561,000
- التكاليف الثابتة: $102,000
- صافي الربح: $357,000 (هامش 35%)
السنة الثالثة
- تم تنفيذ تحسين السعة 90% وتحسين تشكيلة المنتجات
- الإنتاج السنوي: 2.16 مليون كتلة
- الإيرادات: $1,188,000 (ارتفاع متوسط السعر نتيجة لتشكيلة المنتجات)
- تكاليف التشغيل: $583,000
- التكاليف الثابتة: $108,000
- صافي الربح: $497,000 (هامش ربح 42%)
ويعود التوسع في الهامش من السنة الأولى إلى السنة الثالثة إلى الرافعة التشغيلية (توزيع التكاليف الثابتة على عدد أكبر من الكتل)، والعلاقات التفاوضية مع الموردين، وتحسين مزيج المنتجات بالتركيز على المنتجات ذات الهامش الأعلى. وعادةً ما يواجه المشغلون الذين لا يحققون هذا المسار مشكلة تشبع السوق أو ضعف الأداء التشغيلي.
عوامل الخطر وتخفيفها
تواجه كل شركة تعمل في مجال صناعة الطوب أربعة مخاطر رئيسية تهدد ربحيتها. وفهم هذه المخاطر والتخطيط لمواجهتها هو ما يميز الشركات الناجحة عن تلك التي تفشل.
تقلبات أسعار المواد الخام
تتقلب أسعار الأسمنت سنويًّا بنسبة تتراوح بين 20 و30%. وتؤدي الزيادة بمقدار $30 في تكلفة الأسمنت إلى زيادة تكاليف الإنتاج بمقدار $0.015 لكل كتلة. وبالنسبة لإنتاج 200,000 كتلة شهريًا، فإن ذلك يمثل تراجعًا في الأرباح بمقدار $3,000 شهريًا. ويتطلب التخفيف من هذه الآثار إما إبرام عقود طويلة الأجل مع الموردين، أو تكوين مخزون استراتيجي أثناء انخفاض الأسعار، أو إبرام اتفاقيات تسعير تعويضي مع العملاء الرئيسيين.
تقلبات الطلب
يرتبط نشاط البناء بالأوضاع الاقتصادية. فانخفاض الطلب على 30% خلال فترات التباطؤ الاقتصادي يعني الاختيار بين إيقاف تشغيل المعدات (مما يؤدي إلى خسارة استرداد التكاليف الثابتة) أو خفض الأسعار (مما يؤدي إلى تدمير هوامش الربح). ويؤدي التنويع عبر شرائح العملاء (المشاريع السكنية والتجارية والحكومية) وأنواع المنتجات إلى توفير الاستقرار في الطلب.
فترة تعطل المعدات
تؤدي تعطل الآلة إلى توقف الإيرادات، لكنها لا توقف التكاليف الثابتة. ويكلف أسبوع واحد من التوقف عن العمل في خط إنتاج شبه آلي أكثر من $20,000 من الأرباح المفقودة. تساهم جداول الصيانة الوقائية، ومخزون قطع الغيار للمكونات الحيوية (الصمامات الهيدروليكية، ومحركات الاهتزاز)، والدعم الفني من الشركة المصنعة في تقليل هذا الخطر إلى أدنى حد. وتشمل آلات Raytone ضمانات لمدة سنتين ودعمًا لقطع الغيار في أكثر من 100 دولة.
المنافسة في السوق
إن ظهور منافس جديد على بعد 10 كيلومترات يطبق أسعارًا مماثلة يُجبر الشركة إما على خفض هوامش الربح أو خسارة العملاء. وتأتي المزايا التنافسية المستدامة من التميز في الموقع (كون الشركة الأقرب إلى العملاء)، وسمعة الجودة (أدنى معدلات الرفض)، والتميّز في الخدمة (التسليم الموثوق، والدعم الفني، والمنتجات المخصصة). أما المنافسة السعرية وحدها فتؤدي إلى تدمير هوامش الربح على نطاق القطاع بأكمله.
الأسئلة الشائعة
ما هو الحد الأدنى للاستثمار اللازم لبدء مشروع صناعة الطوب؟
تتراوح تكلفة العمليات اليدوية بين $8,000 و$15,000 لآلة من طراز QT4-40 بالإضافة إلى المعدات الداعمة الأساسية. أما الأنظمة شبه الآلية فتتطلب ما بين $35,000 و$50,000. أما الخطوط الأوتوماتيكية فتحتاج إلى ما يزيد عن $100,000 للآلات والبنية التحتية. ويجب أن يشمل إجمالي رأس المال اللازم لبدء التشغيل نفقات التشغيل لمدة 3 أشهر — والتي تبلغ عادةً 1.5 ضعف تكلفة المعدات.
كم من الوقت يستغرق تحقيق التعادل المالي في صناعة الطوب؟
تصل العمليات شبه الآلية إلى نقطة التعادل في غضون 4-6 أشهر عند معدل استغلال السعة البالغ 70%. أما العمليات اليدوية فتستغرق 8-12 شهرًا بسبب انخفاض الإنتاج. أما الخطوط الأوتوماتيكية فتستغرق 10-14 شهرًا بسبب ارتفاع التكاليف الرأسمالية، لكنها تحقق أرباحًا متزايدة بوتيرة أسرع بعد بلوغ نقطة التعادل. ويمتد هذا الجدول الزمني إذا كانت نسبة استخدام الطاقة الإنتاجية أقل من 60% أو في حالة مواجهة منافسة محلية شديدة.
ما هو هامش الربح الذي يمكنني توقعه من صناعة الطوب؟
تحقق العمليات المدارة بشكل جيد هوامش ربح صافي تتراوح بين 35 و45% بعد الوصول إلى مرحلة الإنتاج المستقر. وعادةً ما تتراوح هوامش الربح في السنة الأولى بين 20 و30% خلال مرحلة زيادة الإنتاج التدريجية. أما العمليات اليدوية، فتسجل هوامش ربح تتراوح بين 25 و35%. وتصل الشركات شبه الآلية إلى 35-45%. أما العمليات الآلية فتصل إلى 40-50% عند الاستخدام الكامل. في حين يعاني المشغلون غير الأكفاء من هوامش تتراوح بين 10-20% بسبب الهدر، أو عدم كفاءة المشتريات، أو المنافسة السعرية.
ما هي طريقة الإنتاج التي توفر أفضل عائد على الاستثمار؟
آلات تصنيع الكتل شبه الأوتوماتيكية تحقق عائدًا مثاليًّا على الاستثمار في معظم الأسواق — حيث تتطلب رأس مال أقل مقارنةً بالخطوط الآلية، لكن إنتاجيتها أعلى بـ3 إلى 4 أضعاف مقارنةً بالإنتاج اليدوي. ولا يُعد الإنتاج اليدوي خيارًا منطقيًّا إلا في الأسواق الصغيرة جدًّا أو المناطق التي تتوفر فيها العمالة بأسعار رخيصة للغاية. أما الإنتاج الآلي فيبرر استخدامه عندما يتأكد وجود طلب يتجاوز 800,000 كتلة شهريًّا.
كيف أحسب نقطة التعادل؟
نقطة التعادل = إجمالي التكاليف الثابتة ÷ (سعر البيع للكتلة الواحدة – التكلفة المتغيرة للكتلة الواحدة). إذا كانت التكاليف الثابتة الشهرية $8,000، وكنت تبيع الكتل بسعر $0.50، وكانت التكاليف المتغيرة $0.28، فستحتاج إلى 36,364 كتلة شهريًا لتحقيق نقطة التعادل. وتتجاوز معظم العمليات شبه الآلية هذا الرقم، حيث تبلغ طاقتها الإنتاجية 55%.
ما هي العوامل التي تؤثر على أسعار بيع الكتل؟
نشاط البناء في المنطقة، وتكاليف النقل إلى العملاء، والمنافسة المحلية، وجودة الكتل واتساقها، ونوع المنتج (تحظى كتل الرصف بزيادة في السعر تتراوح بين 20 و40%)، والطلب الموسمي. وتحقق الأسواق الواقعة في نطاق 30 كم من موقع الإنتاج أعلى الأسعار لأن تكاليف النقل تضيف ما بين $0.05 و$0.08 لكل 50 كم للمشترين.
الخلاصة
تعتمد ربحية قطاع صناعة الطوب في عام 2026 بشكل أقل على توقعات نمو السوق، وبشكل أكبر على مواءمة حجم الإنتاج مع الطلب المحلي، والسيطرة على تكاليف المواد الخام، والحفاظ على كفاءة تشغيلية تفوق 70% من السعة. الحسابات واضحة: تحقق العمليات شبه الآلية هوامش ربح صافية تتراوح بين 35 و45%، وتسترد الاستثمار في غضون 6 أشهر بمعدلات استغلال مجربة.
يتطلب النجاح إدراك أن الكتل الخرسانية منتج ثقيل وقيمته منخفضة، حيث يحدد الموقع القدرة التنافسية، وتساهم الجودة الثابتة في كسب ولاء العملاء، كما يساهم تنويع المنتجات في استقرار التدفق النقدي في مواجهة الدورات الموسمية لأعمال البناء. ويتمكن المشغلون الذين ينجحون في تحقيق هذه العوامل الثلاثة من بناء أعمال مربحة حتى في الأسواق التنافسية.
إن وصول سوق آلات تصنيع الطوب الأوتوماتيكية إلى $1.74 مليار يشير إلى تزايد الطلب في قطاع البناء، لكن ربحيتك المحددة تنبع من التنفيذ — شراء المواد الخام بسعر أرخص بنسبة 15% من المنافسين، وتشغيل الطاقة الإنتاجية بنسبة 85% بينما يعملون بنسبة 60%، والحفاظ على معدلات الرفض أقل من 3%. وتتراكم هذه المزايا التشغيلية عبر ملايين الكتل لتشكل هوامش ربح مستدامة لا يستطيع المنافسون مجاراتها.
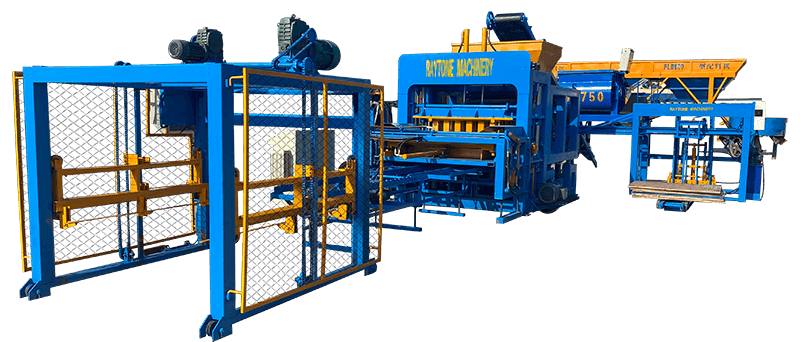
إذا كنت بحاجة إلى معدات موثوقة لإنتاج الطوب لأعمالك، فإن شركة «رايتون بلوك ماشينري» (Raytone Block Machinery) تصنع خطوط إنتاج شبه آلية وآلية أثبتت كفاءتها في أكثر من 100 دولة. يوفر نظامنا شبه الأوتوماتيكي QT4-24 التوازن المثالي بين التكلفة والكفاءة الذي يحتاجه معظم المشغلين، بينما يتناسب خطنا الأوتوماتيكي QT10-15 مع الإنتاج بكميات كبيرة. اتصل بنا اليوم للاطلاع على مواصفات الماكينة والأسعار والدعم الفني المخصص لظروف السوق الخاصة بكم.