Setting prices isn’t about undercutting competitors or picking numbers that feel right—it’s about understanding your true production costs, market positioning, and the margin structure that keeps your business profitable long-term. After analyzing hundreds of block manufacturing operations across three continents, I’ve seen businesses fail not because they couldn’t make quality blocks, but because they priced them wrong from day one.
The difference between a 15% net margin and barely breaking even comes down to knowing your cost per block, pricing strategically for different customer segments, and protecting margins against raw material volatility. This guide breaks down the real numbers, proven pricing frameworks, and margin optimization strategies that separate profitable plants from struggling ones.
Understanding Block Manufacturing Cost Structure
Before pricing anything, you need to know what each block actually costs you—not what your machine supplier estimated or what your neighbor says, but your real, fully-loaded cost per unit.
Raw Material Costs Per Block
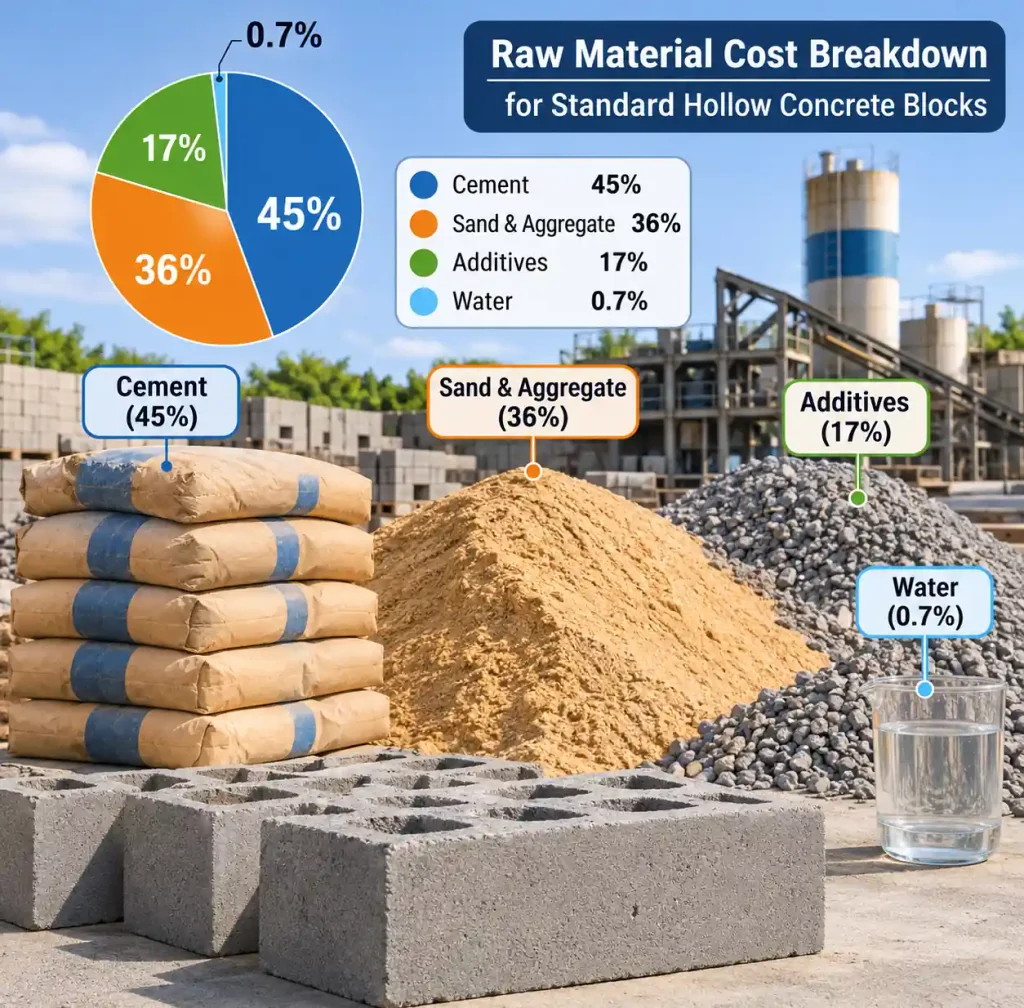
Raw materials typically represent 40-55% of your total production cost, making them the single largest expense category and your biggest vulnerability to margin erosion.
Standard hollow block (400×200×200mm) material breakdown:
| Material | Quantity Per Block | Unit Cost (2026) | Cost Per Block | Cost Percentage |
|---|---|---|---|---|
| Cement (42.5R) | 2.2 kg | $0.12/kg | $0.26 | 45% |
| Sand & Aggregate | 14 kg | $0.015/kg | $0.21 | 36% |
| Water | 1.8 liters | $0.002/L | $0.004 | 0.7% |
| Additives (optional) | 0.05 kg | $2.00/kg | $0.10 | 17% |
| Total Raw Materials | — | — | $0.57 | 98% |
These figures assume standard mix ratios (1:6 or 1:8 cement-to-aggregate) and locally sourced materials. Your actual costs vary by region—cement in East Africa runs $0.09-0.11/kg while Southeast Asia sees $0.13-0.15/kg. Sand quality matters too: quarry-graded material costs 30-40% more than river sand but produces stronger blocks with fewer rejects.
The pricing strategy mistake most startups make is calculating material costs at retail prices. Buy cement in bulk (minimum 500 bags) and you’ll save 12-18% versus buying 50 bags at a time. Negotiate quarterly contracts with aggregate suppliers when you hit 5,000+ blocks/day production.
Labor and Operating Costs
Labor costs vary dramatically by automation level, but they’re more predictable than materials and easier to control through process efficiency.
Daily labor cost analysis (10,000 blocks/day production):
| Production Type | Team Size | Daily Wages | Cost Per Block | Labor % of Total Cost |
|---|---|---|---|---|
| Manual operation | 12-15 workers | $180-240 | $0.018-0.024 | 3-4% |
| Semi-automatic | 6-8 workers | $140-180 | $0.014-0.018 | 2.5-3% |
| Fully automatic | 3-4 workers | $100-140 | $0.010-0.014 | 1.8-2.5% |
These numbers assume standard 8-hour shifts. Many plants run 10-12 hour days to maximize machine utilization, which adds 25-50% overtime premiums but spreads fixed costs across more units—often resulting in lower per-block costs despite higher hourly wages.
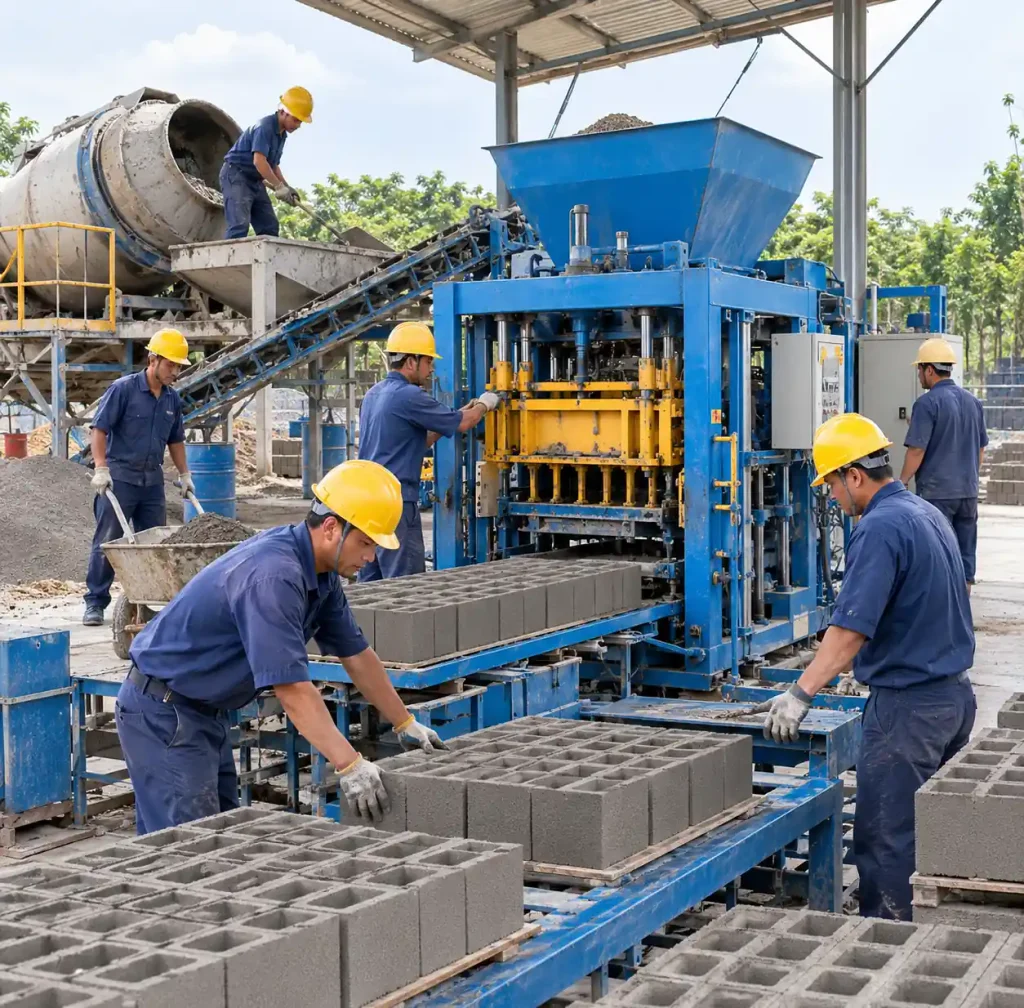
For semi-automatic operations, optimal team structure includes 2 machine operators, 2-3 material handlers, 1 mixer operator, and 1-2 curing yard staff. Overstaffing kills margins—I’ve seen operations running 12 people where 7 would suffice, adding $0.008-0.012 per block in unnecessary labor costs.
Other operating costs (per block):
- Electricity: $0.025-0.040 (varies by machine type and local rates)
- Diesel (for mobile/diesel machines): $0.055-0.075
- Pallets (depreciation): $0.008-0.012
- Molds (depreciation): $0.006-0.010
- Maintenance & repairs: $0.015-0.025
- Water & utilities: $0.003-0.005
Total operating costs typically add $0.062-0.167 per block depending on automation level and local utility rates. Automatic production lines have higher electricity costs but dramatically lower labor requirements, often resulting in 15-20% lower total operating costs at scale.
Fixed Costs and Overhead Allocation
Fixed costs don’t change with daily production volume—they hit your P&L whether you produce 1,000 blocks or 10,000. The key is allocating them correctly per block based on realistic production volumes, not theoretical capacity.
| Fixed Cost Category | Monthly Cost (Medium Plant) | Cost Per Block (10,000/day) | Cost Per Block (5,000/day) |
|---|---|---|---|
| Facility rent/land payment | $2,000-3,500 | $0.007-0.012 | $0.013-0.023 |
| Management salaries | $3,000-5,000 | $0.010-0.017 | $0.020-0.033 |
| Insurance & permits | $500-800 | $0.002-0.003 | $0.003-0.005 |
| Marketing & sales | $800-1,200 | $0.003-0.004 | $0.005-0.008 |
| Admin & office | $600-1,000 | $0.002-0.003 | $0.004-0.007 |
| Loan/financing costs | $1,500-3,000 | $0.005-0.010 | $0.010-0.020 |
| Total Fixed Costs | $8,400-14,500 | $0.029-0.049 | $0.056-0.096 |
Here’s the margin killer: if you budget fixed costs assuming 10,000 blocks/day but only produce 6,000 average, your actual overhead per block is 67% higher than planned. This is why seasonal operations and startups ramping production often show negative margins in their first year—their overhead allocation was based on optimistic projections, not reality.
Smart operators build their pricing models using 75-80% of capacity as the baseline, not 100%. This builds in margin cushion when volume dips and creates windfall profit when you hit capacity.
Calculating Your True Cost Per Block
Now we assemble all components into your fully-loaded production cost—the number that determines whether your pricing makes sense or quietly bankrupts you.
Semi-automatic production example (10,000 blocks/day, standard hollow blocks):
Raw materials: $0.57
Labor: $0.016
Operating costs: $0.095
Fixed overhead: $0.038
Quality control & rejects (2%): $0.014
-----------------------------------
Total cost per block: $0.733
That $0.733 is your break-even point. Sell at $0.73 and you’re operating at a loss once you account for working capital costs and business taxes. Most profitable operations target 30-45% gross margin on materials and labor, which translates to pricing at $0.95-1.05 per block for wholesale and $1.25-1.50 for retail/direct customers.
Cost variation by block type:
| Block Type | Material Cost | Coût total | Typical Selling Price | Gross Margin |
|---|---|---|---|---|
| Standard hollow (400×200×200mm) | $0.57 | $0.73 | $0.95-1.05 | 30-44% |
| Solid block (same size) | $0.89 | $1.05 | $1.35-1.55 | 29-48% |
| Interlocking block | $0.62 | $0.81 | $1.15-1.35 | 42-67% |
| Pavement block | $0.71 | $0.90 | $1.25-1.50 | 39-67% |
Interlocking blocks command 20-35% price premiums over standard blocks despite similar material costs because they’re perceived as higher-value products and serve niche applications. The margin opportunity is real—if you have the molds and market demand.
Industry Standard Profit Margins
Understanding where your margins should land requires knowing what profitable plants actually achieve—not theoretical targets, but real-world numbers from operating businesses.
Gross Profit Margins
Gross margin measures profit after direct costs (materials, labor, operating expenses) but before fixed overhead. This number tells you whether your core production operation is fundamentally profitable.
Industry benchmarks by scale and efficiency:
| Operation Type | Gross Margin Range | Top Quartile Performance | Common Margin Killers |
|---|---|---|---|
| Manual production | 28-42% | 45-52% | High labor costs, material waste, inconsistent quality |
| Semi-automatic | 35-50% | 52-62% | Inefficient material batching, underutilized capacity |
| Fully automatic | 42-58% | 60-68% | High electricity costs, over-capacity for demand |
A healthy semi-automatic operation producing 8,000-12,000 blocks daily should hit 45-55% gross margins. If you’re below 40%, you’re either paying too much for materials, running inefficient operations, or have quality issues driving reject rates above 3-4%.
Top performers achieve 55-65% gross margins through three levers: bulk raw material purchasing (12-18% cost savings), optimized mix ratios that maintain quality while reducing cement content (8-12% savings), and production efficiency that minimizes downtime and rejects (5-8% savings).
Net Profit Margins
Net margin is what’s left after all costs—the number that determines whether your business actually makes money or just keeps you busy.
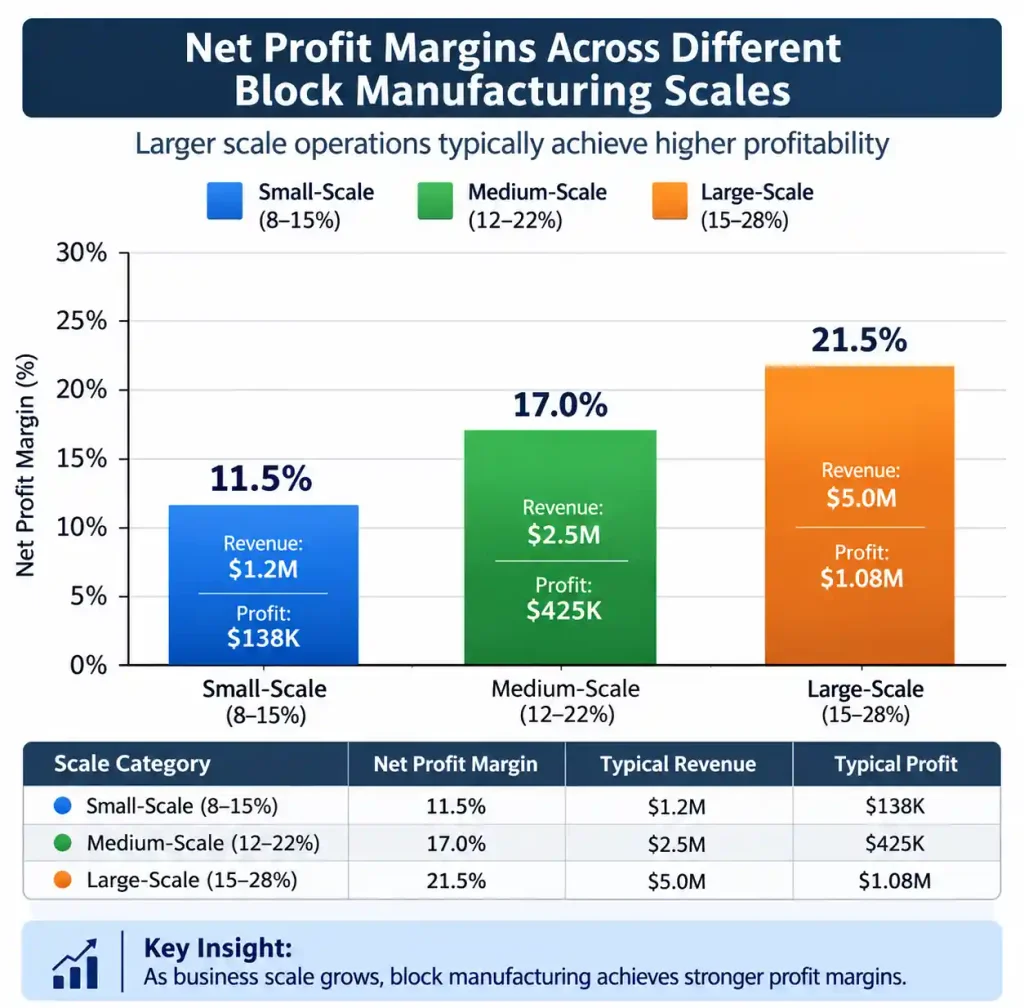
Net margin benchmarks (post-tax, pre-owner compensation):
| Business Scale | Net Margin Range | Annual Revenue | Annual Net Profit |
|---|---|---|---|
| Small-scale (2,000-4,000/day) | 8-15% | $180,000-360,000 | $14,400-54,000 |
| Medium-scale (6,000-12,000/day) | 12-22% | $450,000-950,000 | $54,000-209,000 |
| Large-scale (15,000-30,000/day) | 15-28% | $1.2M-2.4M | $180,000-672,000 |
The 12-22% net margin range for medium-scale operations represents healthy, sustainable businesses. Below 10% net and you’re vulnerable to any cost shock—a 15% cement price increase or losing a major customer wipes out your profit. Above 25% and you’re either extremely efficient, significantly underpriced for your market, or benefiting from temporary conditions (cement price dip, competitor exit).
Industry data shows the typical progression: startups operate at 5-8% net margins in year one while ramping production and building customer base, hit 12-18% by year two as operations stabilize, and plateau at 18-25% for mature operations with established routes and customers.
Market Positioning and Pricing Strategy
Cost-plus pricing (cost + margin = price) is a starting point, not a strategy. Real pricing decisions factor in market positioning, customer segments, and competitive dynamics.
Wholesale vs Retail Pricing
Most block plants serve multiple customer types with different price points—trying to serve everyone at one price leaves money on the table.
Typical pricing structure by channel:
| Customer Segment | Volume Threshold | Price Per Block | Margin | Payment Terms |
|---|---|---|---|---|
| Retail/walk-in | 1-200 blocks | $1.35-1.65 | 45-55% | Immediate payment |
| Small contractor | 200-2,000 blocks | $1.15-1.35 | 35-45% | 50% deposit, balance on delivery |
| Regular contractor | 2,000-5,000 blocks | $0.98-1.15 | 25-35% | 30-day terms |
| Large contractor/bulk | 5,000+ blocks | $0.88-1.05 | 18-28% | 30-60 day terms |
| Distributor/reseller | 10,000+ blocks | $0.82-0.95 | 12-22% | 45-60 day terms |
That $1.65 retail price on a $0.73 cost block isn’t gouging—it reflects small-order handling costs, credit risk, and the premium customers pay for convenience and immediate availability. The $0.88 bulk price still delivers healthy margins because large orders reduce handling, logistics, and credit costs per block.
Smart pricing means saying no to bad business. A distributor demanding $0.75/block at 90-day payment terms when your cost is $0.73 isn’t a customer—they’re asking you to finance their business at negative margins.
Geographic and Competitive Pricing
Market pricing varies by region based on local demand, competition, and material costs. National averages are useless—what matters is your local competitive landscape.
Regional pricing patterns (standard hollow block, 2026):
- Urban markets (high competition): $0.95-1.15 wholesale, $1.30-1.55 retail
- Suburban/peri-urban: $1.05-1.25 wholesale, $1.40-1.70 retail
- Rural/remote areas: $1.20-1.50 wholesale, $1.60-2.00 retail
- Infrastructure boom zones: $1.15-1.45 wholesale, $1.50-1.90 retail
The 25-40% price premium in remote areas isn’t price gouging—it reflects higher logistics costs, smaller order volumes, and limited competition. If you’re the only supplier within 50km, your pricing power increases but so does your delivery cost and working capital tied up in inventory.
Study your top three competitors’ pricing, then position yourself based on differentiation. Matching the lowest price in town when you deliver better quality and reliability is leaving 15-25% margin on the table. Pricing 10-15% above commodity suppliers when you offer better service, credit terms, and technical support is perfectly defensible—if you can articulate the value difference.
Volume Discount Structures
Volume discounts aren’t generosity—they’re margin optimization. Larger orders reduce per-unit handling costs, improve production scheduling, and lower credit risk through deposit requirements.
Effective volume discount framework:
Base price (1-500 blocks): $1.35/block
5% discount (501-2,000 blocks): $1.28/block
8% discount (2,001-5,000 blocks): $1.24/block
12% discount (5,001-10,000 blocks): $1.19/block
15% discount (10,000+ blocks): $1.15/block
This structure maintains 38-45% gross margins across all tiers while creating clear incentives for customers to increase order sizes. The 15% discount at 10,000 blocks isn’t undercutting your margin—your actual cost per block drops 8-10% at that volume due to reduced handling, fewer delivery trips, and more efficient production scheduling.
Avoid the trap of flat percentage discounts on everything. A 10% discount across the board when competing for a large project erodes margin unnecessarily. Instead, negotiate volume discounts that reflect your actual cost structure improvements at scale.
Strategies to Maximize Profit Margins
Margin optimization isn’t one big change—it’s systematically attacking every cost element while protecting or expanding your revenue per block.
Material Cost Optimization
Raw materials represent 40-55% of your cost structure, making them the highest-leverage area for margin improvement.
Proven cost reduction strategies:
- Bulk purchasing agreements: Negotiate quarterly cement contracts at 500-1,000 bag volumes for 12-18% savings versus spot buying. Lock in pricing when cement costs dip—a $0.02/kg savings on cement drops your cost per block by $0.044.
- Mix ratio optimization: Standard 1:6 cement-to-aggregate ratios are conservative. Testing 1:7 or 1:8 ratios (while maintaining strength standards) can reduce cement consumption 12-18% without compromising quality. A $0.08/block savings at 10,000 blocks/day is $24,000 annual profit increase.
- Alternative materials: Partial cement replacement with fly ash (15-25%) or slag (20-30%) reduces material costs 8-14% while often improving block properties. Requires testing and may face customer perception issues, but the margin impact is substantial.
- Local sourcing: Every kilometer aggregate travels adds $0.001-0.003 per block in logistics costs. Sourcing sand and aggregate within 20km versus 60km can save $0.020-0.045 per block—call it $60,000-135,000 annually at 10,000 blocks/day.
- Reject rate reduction: Every rejected block costs you full materials plus labor but generates zero revenue. Reducing rejects from 4% to 2% improves effective material costs by 2% and adds $14,600 annual profit on 10,000 blocks/day production.
Operational Efficiency Improvements
Production efficiency directly translates to margin—higher output from the same fixed costs reduces per-block overhead while improving material utilization.
High-impact efficiency levers:
| Improvement Area | Typical Gain | Cost Per Block Impact | Implementation Difficulty |
|---|---|---|---|
| Reduce machine downtime (12% to 6%) | 6% capacity increase | -$0.018-0.028 | Medium (preventive maintenance focus) |
| Optimize batching process | 3-5% material waste reduction | -$0.017-0.029 | Low (process training) |
| Improve curing management | 1-2% reject reduction | -$0.007-0.014 | Low (better scheduling) |
| Add second shift | 60-80% capacity utilization | -$0.035-0.055 | High (labor, management complexity) |
| Automate material handling | 15-25% labor reduction | -$0.024-0.040 | High (capital investment required) |
The single highest-return efficiency improvement for most operations is reducing unplanned downtime. Six hours of unplanned downtime per week at 10,000 blocks/day capacity costs you 7,500 blocks monthly in lost production—that’s $7,125-10,875 in lost gross profit.
Implementing basic preventive maintenance (weekly hydraulic system checks, monthly vibration motor inspection, quarterly mold condition assessment) typically reduces downtime 40-60% and pays for itself within 8-12 weeks through improved output and margin protection.
Product Mix and Specialty Blocks
Not all blocks deliver the same margin—strategic product mix optimization can lift overall profitability 12-25% without changing operational efficiency.

Margin comparison by block type (using same base equipment):
| Product Type | Material Cost | Selling Price | Gross Margin | Market Demand | Production Complexity |
|---|---|---|---|---|---|
| Standard hollow block | $0.57 | $1.05 | 46% | Very high | Low |
| Solid block | $0.89 | $1.45 | 39% | Medium | Low |
| Interlocking block | $0.62 | $1.30 | 52% | Medium | Medium |
| Paver block | $0.71 | $1.40 | 49% | Medium-high | Medium |
| Colored/decorative block | $0.75 | $1.65 | 55% | Low-medium | High |
| Curb block | $0.68 | $1.35 | 50% | Medium | Medium |
The margin opportunity is clear: shifting 20% of production from standard hollow blocks (46% margin) to interlocking blocks (52% margin) improves overall margin 1.2 percentage points—call it $18,000-28,000 additional annual profit at medium scale.
Customer demand limits how far you can push high-margin specialty products, but most operations underproduce them because “standard blocks are easier.” That’s true, but easier doesn’t mean more profitable. Dedicating one day per week to paver block production or interlocking blocks can lift monthly margins 8-15% while differentiating you from commodity block suppliers.
Pricing for Different Customer Segments
One-size-fits-all pricing leaves money on the table with customers who’d pay more and loses business from price-sensitive segments who’d buy volume at lower margins.
Contractor Pricing Programs
Contractors are your bread-and-butter customers—they order consistently, buy volume, and value reliability over rock-bottom pricing. Treat them accordingly.
Effective contractor pricing framework:
Tier 1 – Preferred Contractors (10,000+ blocks/month):
- Base price: 15-18% below retail
- Payment terms: 45-day net terms after deposit
- Value-adds: Free delivery within 30km, priority scheduling during busy seasons, dedicated account management
- Margin: 25-32% gross
Tier 2 – Regular Contractors (3,000-10,000 blocks/month):
- Base price: 10-12% below retail
- Payment terms: 30-day net after 30% deposit
- Value-adds: Free delivery on orders above 2,000 blocks
- Margin: 30-38% gross
Tier 3 – Occasional Contractors (below 3,000 blocks/month):
- Base price: 5-8% below retail
- Payment terms: 50% deposit, balance on delivery
- Value-adds: Standard delivery pricing
- Margin: 38-45% gross
The tier structure isn’t about extracting maximum price from small customers—it reflects real cost differences in serving different segments. A preferred contractor ordering 12,000 blocks monthly with 45-day terms and single delivery is fundamentally cheaper to serve than an occasional buyer placing three 400-block orders requiring three delivery trips.
Contractors care about reliability and service as much as price. Delivering when promised, maintaining consistent quality, and offering flexible scheduling creates loyalty that insulates you from competitors undercutting by $0.05/block.
Retail and Walk-In Customers
Retail customers pay premium pricing because they’re buying convenience, immediate availability, and small quantities. Don’t apologize for the price—communicate the value.

Retail pricing strategy:
- Base retail price: 35-50% above wholesale
- Minimum order: None (some operations set 50-100 block minimums)
- Payment: Immediate (cash, card, or mobile money)
- Delivery: Charged separately at $0.08-0.15 per block depending on distance
- Margin: 45-55% gross
Retail customers are margin gold—your cost to serve them is higher (smaller transactions, more handling, credit card fees), but the price premium more than compensates. A $1.50 retail price on a $0.73 cost block delivers 51% gross margin—that’s 15-20 percentage points higher than wholesale business.
Many operations underinvest in retail because “contractors buy more volume.” True, but retail customers pay immediately, don’t negotiate, and create cash flow stability during contractor slow periods. Allocating 15-20% of production capacity to retail and walk-in business improves overall margin mix and reduces working capital pressure from contractor payment terms.
Project and Bulk Orders
Large projects (20,000+ blocks) require different pricing logic—margins compress but volume and payment terms matter more than per-block profit.
Bulk order pricing considerations:
- Cost structure changes at scale: Dedicated production runs reduce setup costs, consolidated delivery drops logistics costs 25-40%, and single-invoice administration reduces overhead per block.
- Working capital requirements: A 50,000-block order at 30% deposit and 60-day balance terms ties up $25,550 in working capital for 75-90 days. Factor this into your pricing—3-4% cost of capital adds $0.008-0.010 per block to your true cost.
- Competitive bidding dynamics: Large projects typically involve competitive bids where lowest price wins. Determine your walk-away price (minimum profitable margin) before bidding—winning business at 8% gross margin isn’t winning.
Bulk order pricing framework:
- Orders above 20,000 blocks: Cost + 18-25% gross margin
- Orders above 50,000 blocks: Cost + 15-22% gross margin
- Payment terms: 30-40% deposit, 40% at 50% delivery, balance within 30 days of completion
- Pricing includes: Delivery within specified radius, technical support, quality certificates
The margin compression on bulk orders isn’t margin giveaway—it reflects real cost advantages at scale and competitive market dynamics. A 20% gross margin on a 60,000-block order is more valuable than a 45% margin on 2,000 blocks—the absolute dollar profit matters, not just the percentage.
Common Pricing Mistakes to Avoid
Pricing errors compound over time—a $0.05 underpricing mistake costs you $15,000 annually at 10,000 blocks/day. Here’s what kills margins:
1. Pricing based on competition without knowing your costs
Seeing competitors at $0.95/block and matching their price seems logical—except if your cost structure is $0.88 and theirs is $0.68, you’re operating at 7% margin while they’re at 40%. Always price from your cost structure first, then adjust for competitive positioning.
2. Ignoring working capital costs in payment terms
Offering 60-day payment terms without adjusting pricing costs you 3-5% in effective margin through working capital financing. If your capital costs 12% annually, 60-day terms cost you 2% per transaction—that’s $0.014-0.021 per block you’re effectively giving away.
3. Flat discounting without volume thresholds
“10% off for contractors” sounds simple but destroys margin structure. The contractor buying 500 blocks monthly gets the same discount as the one buying 8,000 blocks—meaning you’re giving away margin unnecessarily on the small orders. Tier your discounts based on actual volume commitments.
4. Underpricing during startup to “gain market share”
Pricing at break-even or below to win customers teaches the market that your blocks are worth less and attracts the most price-sensitive, lowest-loyalty customers. You can’t raise prices significantly later without losing them. Better to start at market-appropriate pricing and compete on quality, service, and reliability.
5. Not adjusting prices for input cost changes
Cement prices increased 8-12% across most markets in 2025-2026. If you didn’t adjust pricing, that increase came straight out of your margin—call it a 10-15 percentage point margin compression. Build price adjustment mechanisms into contracts for orders above 30 days out or implement quarterly pricing reviews.

6. Treating all rejects as unavoidable
A 5% reject rate feels normal until you realize it’s costing you $0.037 per good block in wasted materials and labor. Tracking reject reasons (weak blocks, dimensional errors, surface defects) and implementing quality controls typically reduces rejects 40-60%, improving effective margins 2-3 percentage points.
7. Ignoring delivery and logistics costs
Free delivery sounds customer-friendly but costs $0.08-0.15 per block. Offering it on all orders regardless of size or distance transfers 8-15% margin to customers as a hidden subsidy. Either build delivery into pricing or charge it separately—don’t absorb it silently.
FAQ
What is a good profit margin for block manufacturing business?
Net profit margins of 15-25% are considered healthy for established block manufacturing operations at medium to large scale (8,000-20,000 blocks/day). Small-scale startups typically achieve 8-15% net margins in their first 1-2 years while building customer base and optimizing operations. Gross margins should target 40-55% for semi-automatic operations and 45-60% for fully automatic production lines. Margins below 10% net indicate pricing problems, inefficient operations, or excessive overhead costs that need immediate attention.
How much does it cost to make one concrete block?
Total production cost for a standard hollow concrete block (400×200×200mm) ranges from $0.68-0.82 per block depending on automation level, material costs, and production scale. This breaks down to approximately $0.55-0.60 for raw materials (cement, sand, aggregate), $0.01-0.03 for labor, $0.06-0.12 for operating costs (electricity, pallets, maintenance), and $0.03-0.07 for overhead allocation. Costs decrease 15-25% per block at higher production volumes due to bulk material purchasing, improved efficiency, and better overhead absorption.
What is the selling price of one concrete block?
Standard hollow block selling prices vary by customer segment and region: wholesale prices range from $0.85-1.15 per block for large contractors and bulk orders, mid-tier contractor pricing runs $1.05-1.35 per block, and retail/walk-in pricing ranges $1.30-1.65 per block. Remote or underserved markets support 15-30% price premiums versus urban areas with high competition. Specialty blocks (interlocking, pavers, decorative) command 20-50% premiums over standard blocks. Market positioning, quality consistency, and service reliability justify premium pricing above commodity market rates.
How do you calculate cost per block in manufacturing?
Calculate cost per block by summing all direct and indirect costs then dividing by production volume: (1) Raw material costs per block based on actual mix ratios and current material prices, (2) Direct labor costs per block (total daily wages / daily output), (3) Operating costs including electricity, diesel, water, pallet and mold depreciation, (4) Fixed overhead allocated based on realistic production volume not theoretical capacity, and (5) Quality costs including reject rate impact. Use 75-80% of capacity for overhead allocation to avoid underestimating true costs. Update your cost calculation monthly as material prices fluctuate.
What pricing strategy works best for block manufacturing?
Effective block manufacturing pricing uses tiered volume-based pricing rather than single flat rates: establish 4-5 customer segments (retail, small contractor, regular contractor, preferred contractor, bulk/project) with distinct pricing reflecting actual cost-to-serve differences. Price retail customers 40-55% above production cost for immediate payment and convenience, offer 10-18% discounts to regular contractors with volume commitments, and negotiate bulk project pricing at 18-28% margins accounting for working capital costs from extended payment terms. Implement annual or semi-annual price reviews tied to cement cost indices rather than waiting for margin erosion before adjusting prices.
How do you protect profit margins when cement prices increase?
Protect margins during material cost increases through: (1) Build price adjustment clauses into contracts for orders beyond 30 days, typically tying pricing to cement cost indices with 60-90 day lag, (2) Implement quarterly pricing reviews rather than waiting for annual cycles when material costs are volatile, (3) Secure bulk purchasing agreements that lock prices for 3-6 month periods during favorable pricing windows, (4) Optimize mix ratios to reduce cement content while maintaining strength specifications—moving from 1:6 to 1:7 ratios reduces cement costs 14-17%, (5) Communicate price increases to customers 30-45 days in advance with clear explanation tied to documented input cost changes, and (6) Shift product mix toward higher-margin specialty blocks that maintain better price premiums during commodity cost inflation cycles.
Conclusion
Block manufacturing profitability comes down to knowing your true costs, pricing strategically across customer segments, and systematically optimizing every margin lever in your operation. The difference between a 12% net margin and a 22% margin isn’t luck or market conditions—it’s understanding that materials represent 40-55% of your costs and warrant bulk purchasing agreements, that customer segments have fundamentally different cost-to-serve profiles justifying 25-45% pricing spreads, and that operational efficiency improvements reducing reject rates from 4% to 2% deliver immediate margin expansion.
Successful block manufacturers price from cost structure first and competitive positioning second, implement tiered volume-based pricing that reflects real economic differences across customer segments, and protect margins through quarterly pricing reviews tied to material cost indices rather than absorbing input cost inflation. They track cost per block monthly, allocate overhead based on realistic production volumes not theoretical capacity, and systematically attack material waste and operational inefficiency that erodes profitability.
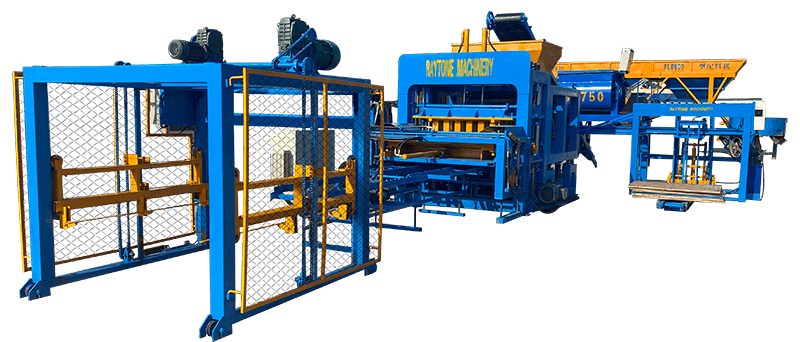
If you need reliable automatic block making machines that improve production efficiency and reduce per-block costs, Raytone Block Machinery offers proven equipment for operations from 5,000 to 50,000 blocks daily. Our technical team helps optimize your production setup and cost structure for maximum profitability. Contact us for equipment specifications, ROI analysis, and pricing tailored to your production scale and market conditions.
Sources:
- Block Making Business Guide 2026: Startup Costs, Profit Margins & Equipment
- How Much Does it Cost to Make a Concrete Block? 2026 Full Breakdown
- Concrete Block Cost 2026 — Price Per Block, Pallet & Installed
- How to improve manufacturing profitability and margins
- Manufacturing Pricing Strategy to Improve Margins