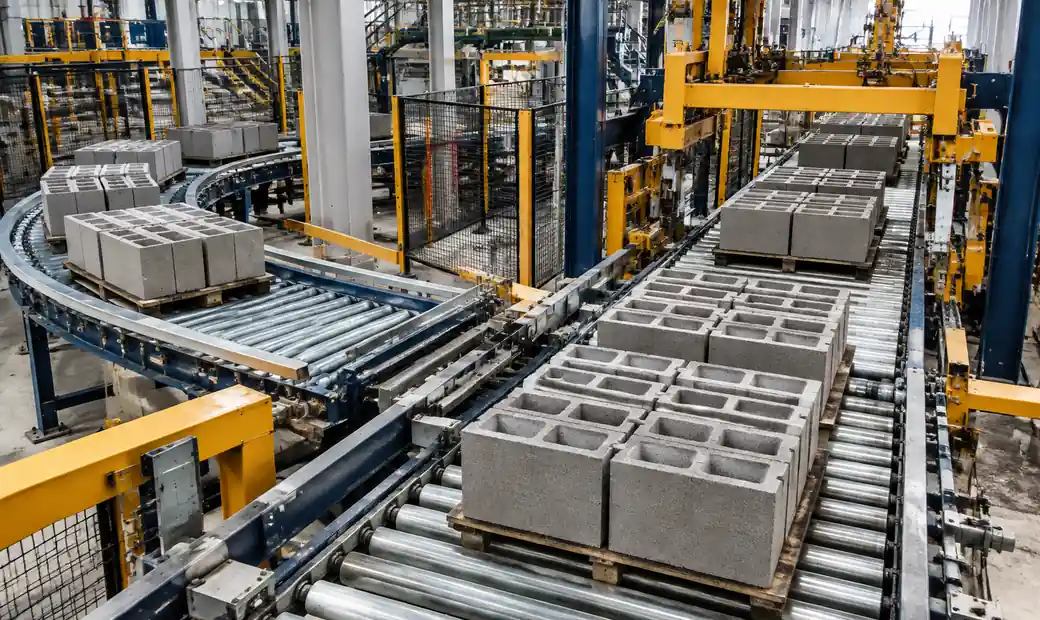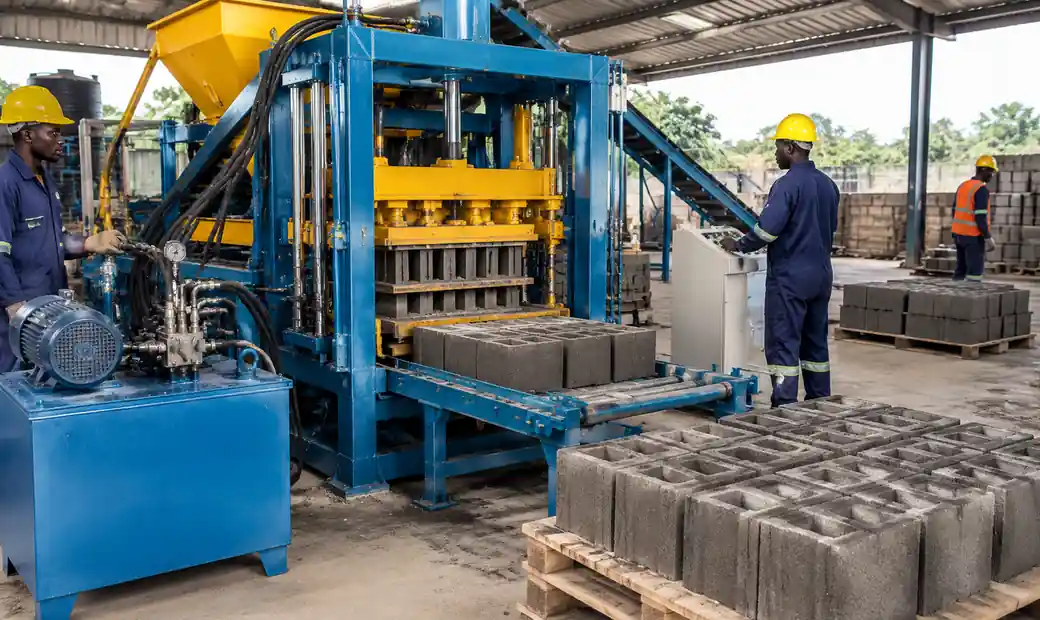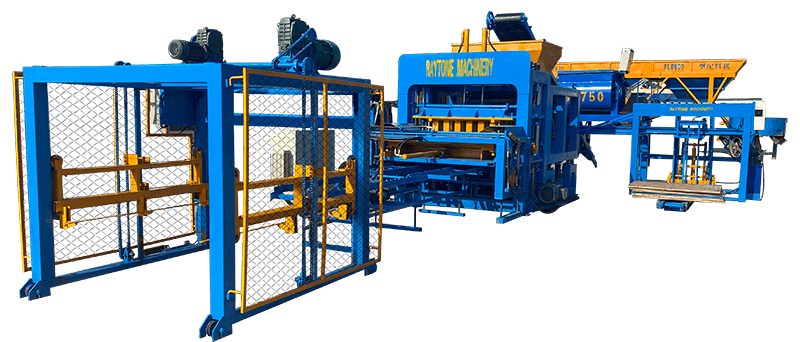
Automated block manufacturing operations face mounting pressure from energy costs that now represent 12-18% of total production expenses. A mid-scale facility producing 25,000 blocks daily typically consumes 800-1,500 kWh, translating to $35,000-70,000 in annual electricity bills—yet most producers focus exclusively on raw material costs while ignoring energy optimization opportunities that could reduce consumption by 30-50% without impacting output quality or speed.
Research shows that electrical energy represents 37% of total energy costs in cement and concrete manufacturing industries. With automatic block making machines market reaching $1.61 billion in 2025 and expected to grow to $2.4 billion by 2030, the economics of energy-efficient automation have never been more compelling. This guide examines proven energy optimization strategies, automation technologies, and real-world data from operations achieving 40%+ energy reductions.
Understanding Energy Consumption in Automated Block Production
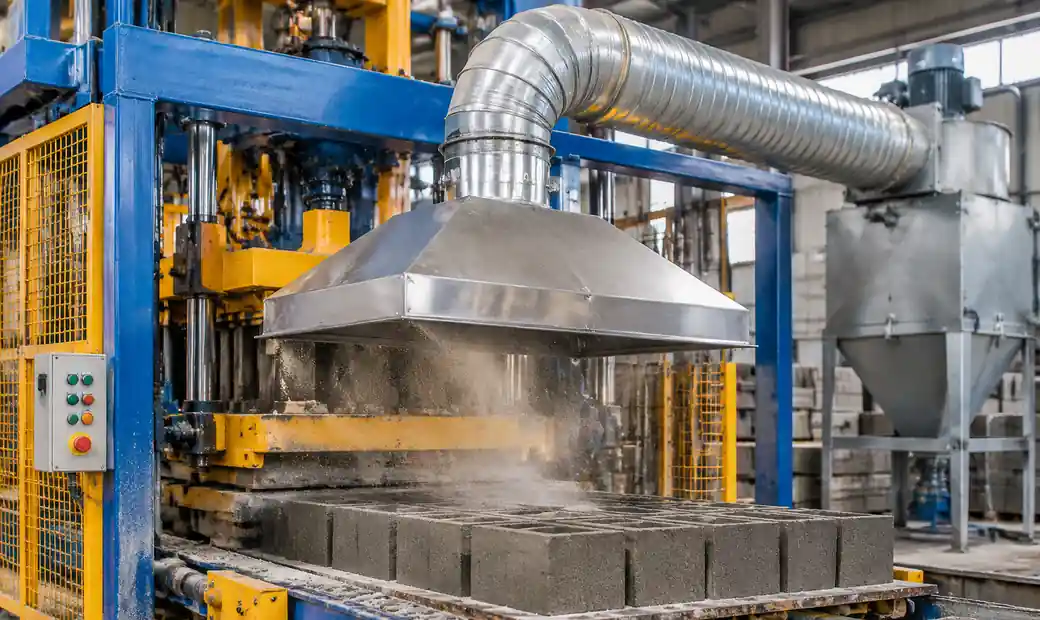
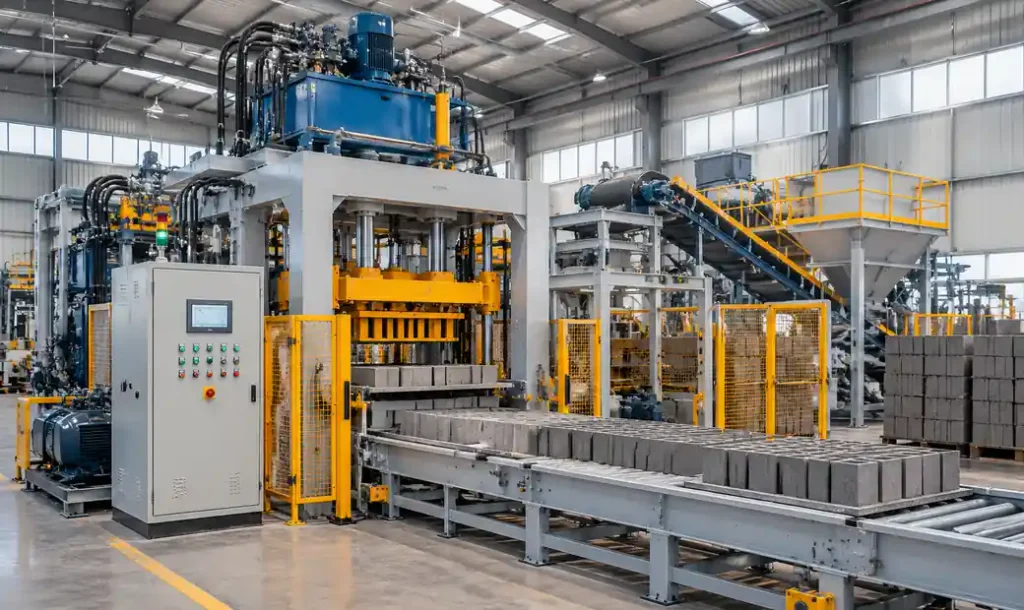
Automated block manufacturing systems consume energy through five primary subsystems: hydraulic power units generating compression forces, vibration systems ensuring density and strength, material handling equipment transporting aggregates and finished products, batching and mixing systems preparing concrete, and supporting infrastructure including controls, lighting, and curing environments.
Energy Distribution Across Production Systems
Optimizing concrete block production through variable-speed hydraulic systems has demonstrated productivity increases up to 50% while simultaneously halving energy consumption. The distribution of energy usage varies significantly based on automation level and production scale.
| System Component | Energy Share | Optimization Potential | Key Technologies |
|---|---|---|---|
| Hydraulic Power Unit | 45-55% | 30-50% reduction | VFD, servo pumps, pressure optimization |
| Vibration System | 18-25% | 15-25% reduction | Variable frequency control, optimized cycles |
| Material Handling | 12-18% | 20-30% reduction | Conveyor VFDs, regenerative systems |
| Batching & Mixing | 8-12% | 10-20% reduction | Load-based motor control, efficient mixers |
| Supporting Systems | 5-10% | 25-40% reduction | LED lighting, smart controls, power factor correction |
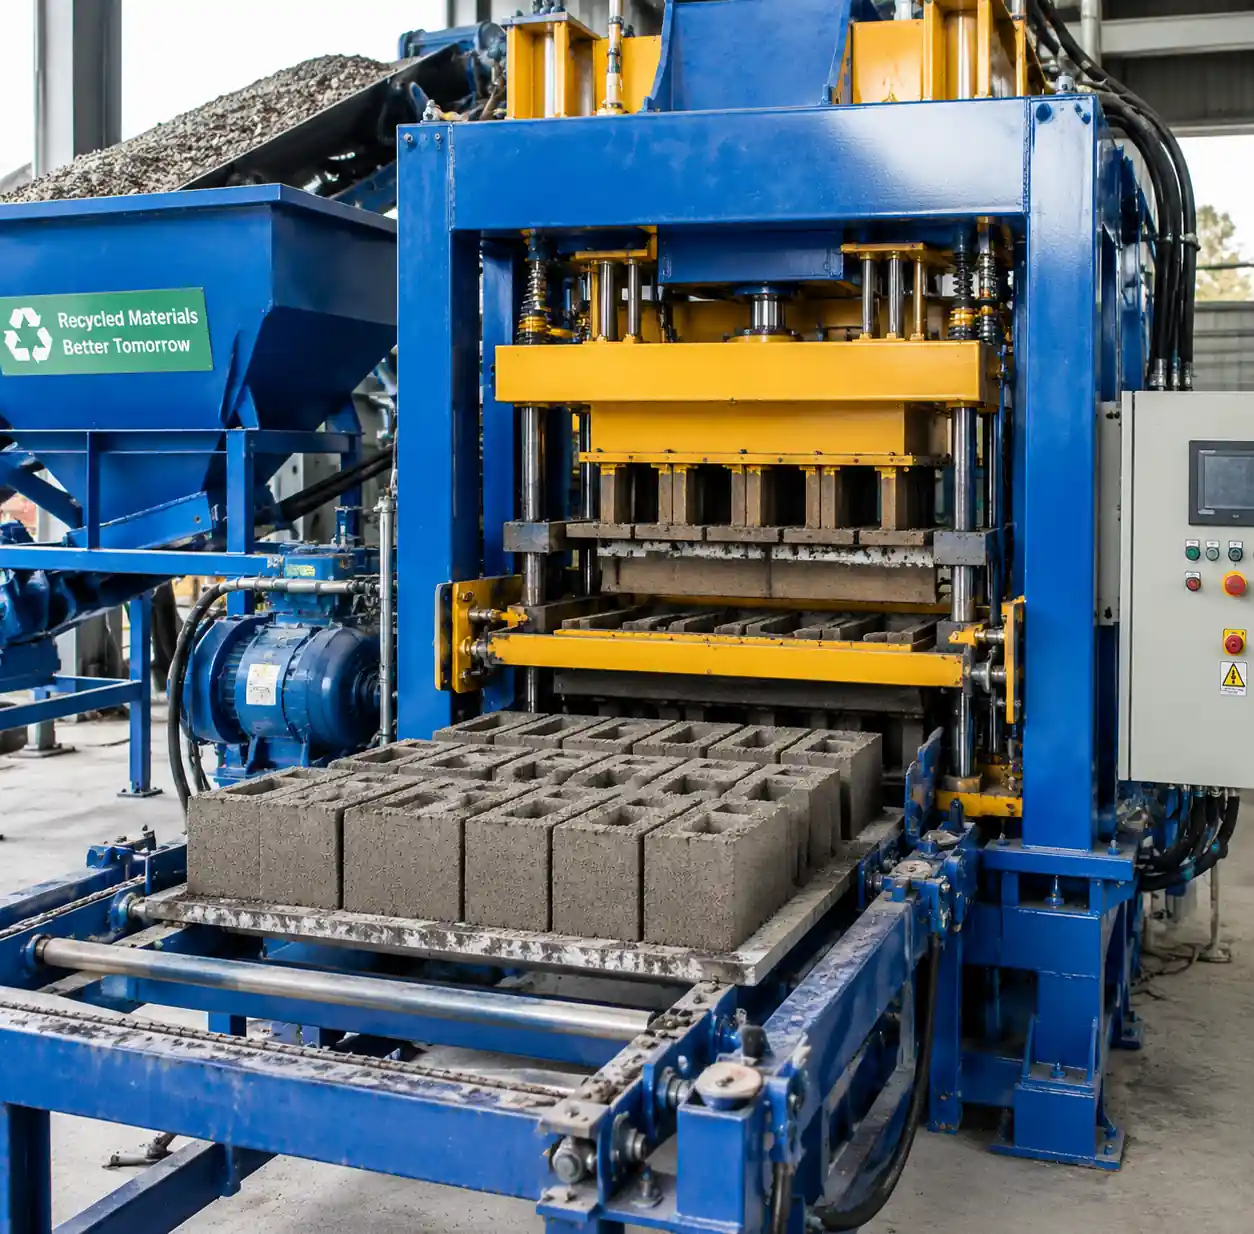
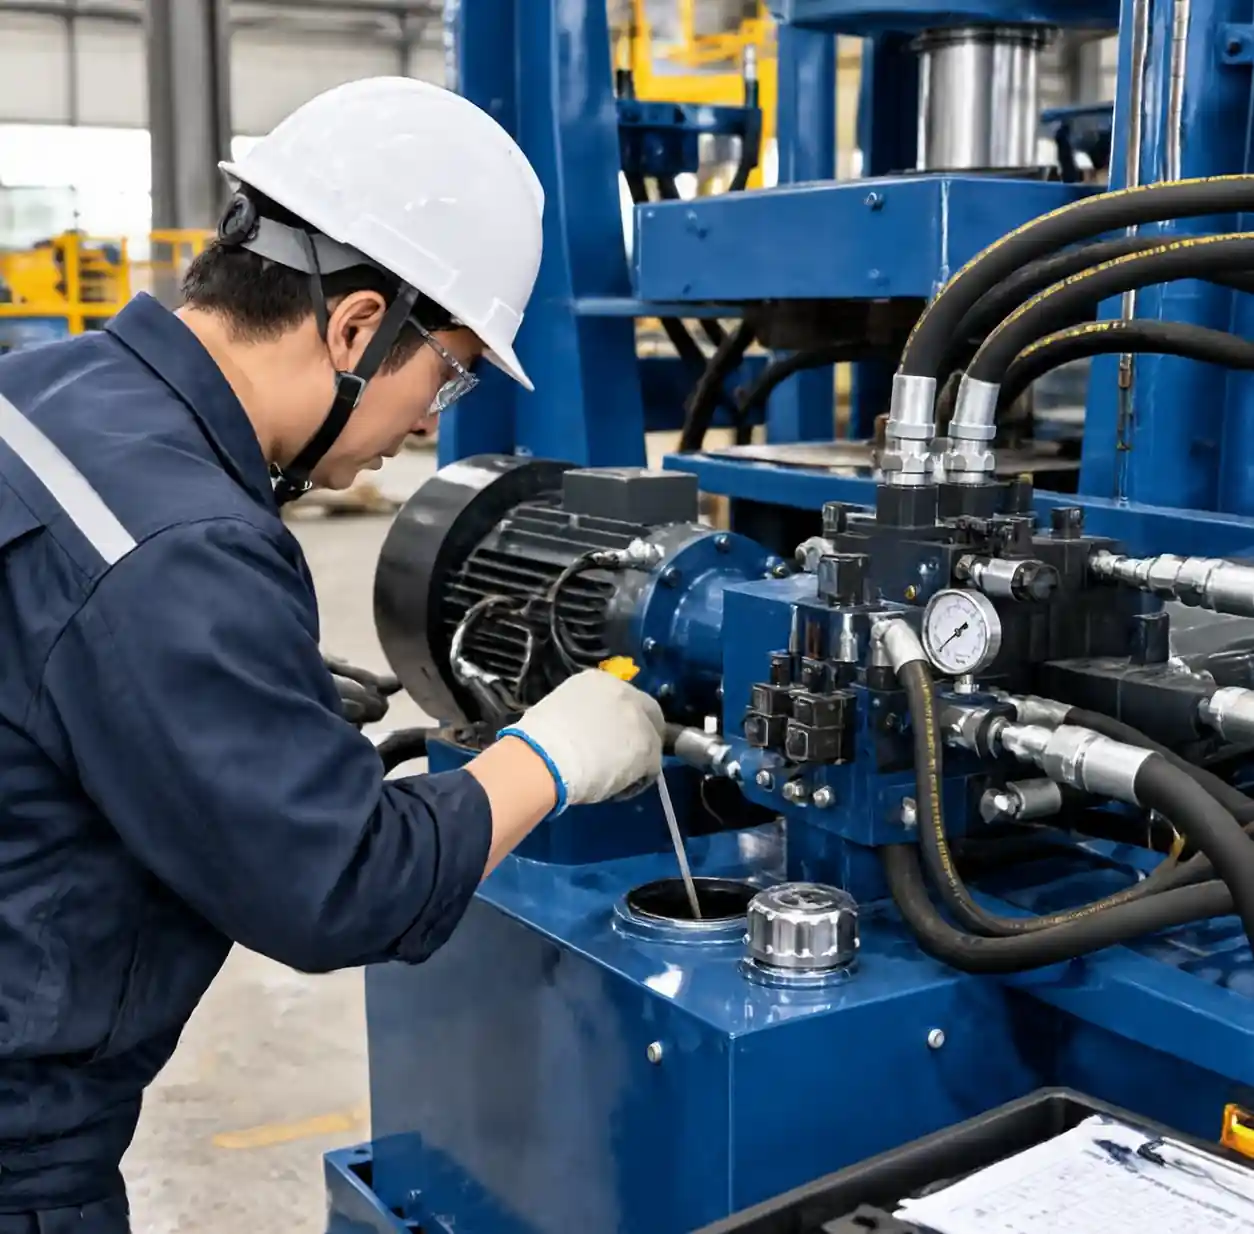
The hydraulic power unit dominates energy consumption because it must generate 160-250 bar pressure to compress concrete material into dense blocks. Hydraulic systems traditionally waste approximately 79% of input energy as heat, making them the primary target for efficiency improvements in automated operations.
Automation Impact on Energy Efficiency
Automation fundamentally changes the energy equation by enabling precise control, eliminating idle time, and optimizing cycle parameters impossible with manual operations. Fully automatic systems consume more total energy but deliver dramatically better per-block efficiency through continuous operation and intelligent load management.
| Production Level | نوع الآلة | Daily Output | Total Energy | Energy per Block | Efficiency Gain vs Manual |
|---|---|---|---|---|---|
| Small Scale | Manual/Semi-Auto | 3,000-5,000 blocks | 120-200 kWh | 0.040-0.050 kWh | Baseline |
| Mid Scale | آلة القطع الأوتوماتيكية | 15,000-25,000 blocks | 480-800 kWh | 0.032-0.038 kWh | 20-25% improvement |
| Large Scale | Fully Automated Line | 35,000-50,000 blocks | 1,120-1,600 kWh | 0.028-0.034 kWh | 30-35% improvement |
Automated systems achieve superior efficiency through PLC-based cycle optimization, eliminating human reaction delays, and coordinating subsystem operation to minimize peak demand and idle consumption.
Proven Energy Optimization Technologies
Modern energy-efficient block manufacturing combines multiple proven technologies that address different consumption sources. Implementation sequencing matters—starting with high-impact hydraulic system upgrades yields faster ROI than beginning with minor supporting system improvements.
Variable Frequency Drives for Hydraulic Motors
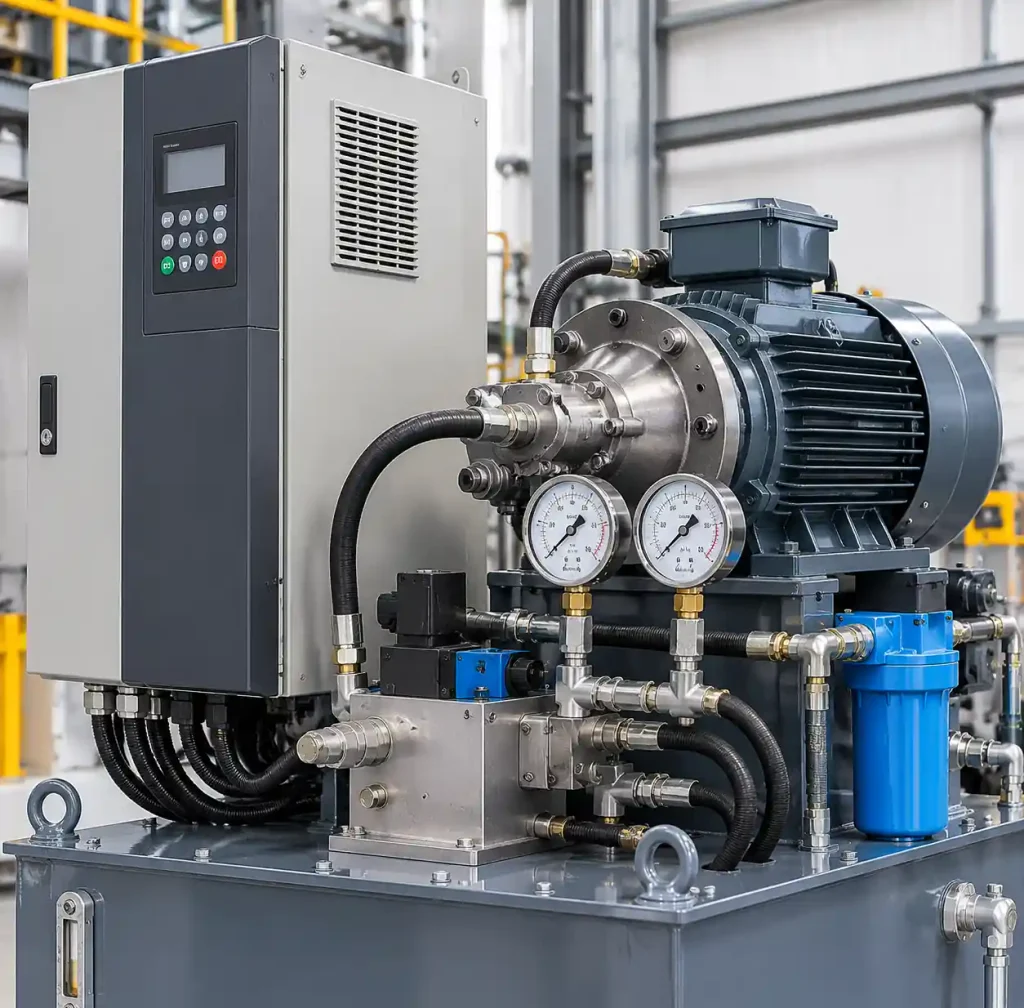
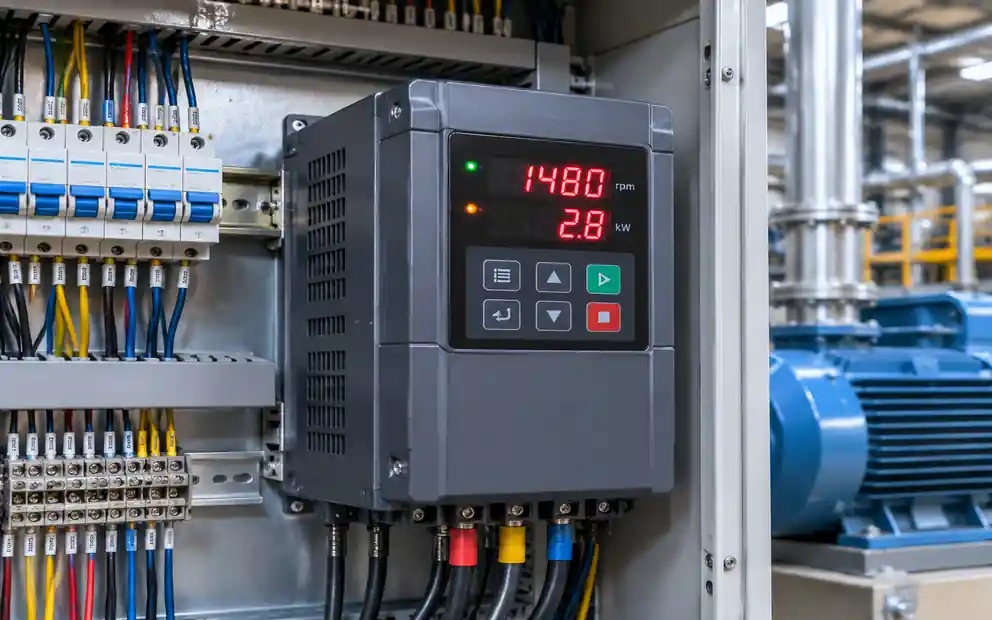
VFD technology reduces motor energy consumption by 20-80% depending on load variability. Block production cycles create ideal conditions for VFD application because hydraulic pumps need full power during 8-15 second compression phases but minimal flow during 20-30 second material loading and mold positioning periods.
Implementation Details:
Installing VFDs on hydraulic pump motors (30-75 kW range) allows motor speed reduction to 40-60% during non-compression phases rather than running full speed with pressure relief valves dumping excess flow as waste heat. The energy savings compound because reduced motor speed also decreases hydraulic fluid heating, reducing cooling system loads.
Savings Calculation:
A 45 kW hydraulic motor running 10 hours daily at constant speed consumes 450 kWh. With VFD reducing speed 50% during 65% of cycle time, consumption drops to 326 kWh (calculated as: 100% × 35% + 50% × 65% = 67.5% average load)—saving 124 kWh daily or $447 monthly at $0.12/kWh. VFD installation cost ($3,200-5,800) typically recovers within 10-14 months.
Intelligent frequency conversion hydraulic systems achieve 30-50% energy savings compared to fixed-speed configurations while also reducing hydraulic fluid heating and extending component life through gentler operation.
Servo-Hydraulic Systems
Advanced servo-hydraulic technology replaces conventional valve-controlled systems with direct servo motor control of hydraulic pumps. This eliminates throttling losses that waste 40-60% of energy in traditional valve systems by precisely matching pump output to instantaneous demand.
Performance Benefits:
Servo systems deliver hydraulic flow only when needed at exact required pressures, eliminating continuous circulation and pressure relief valve bypass. Energy consumption drops 35-55% compared to conventional systems while providing superior pressure control for consistent block quality.
Cost Analysis:
Initial investment runs 40-60% higher than conventional hydraulic systems ($12,000-18,000 premium on mid-capacity machines), but energy savings of $400-700 monthly justify the investment within 18-24 months. Additional benefits include reduced maintenance from lower operating temperatures and extended hydraulic fluid life.
Optimized Vibration System Control
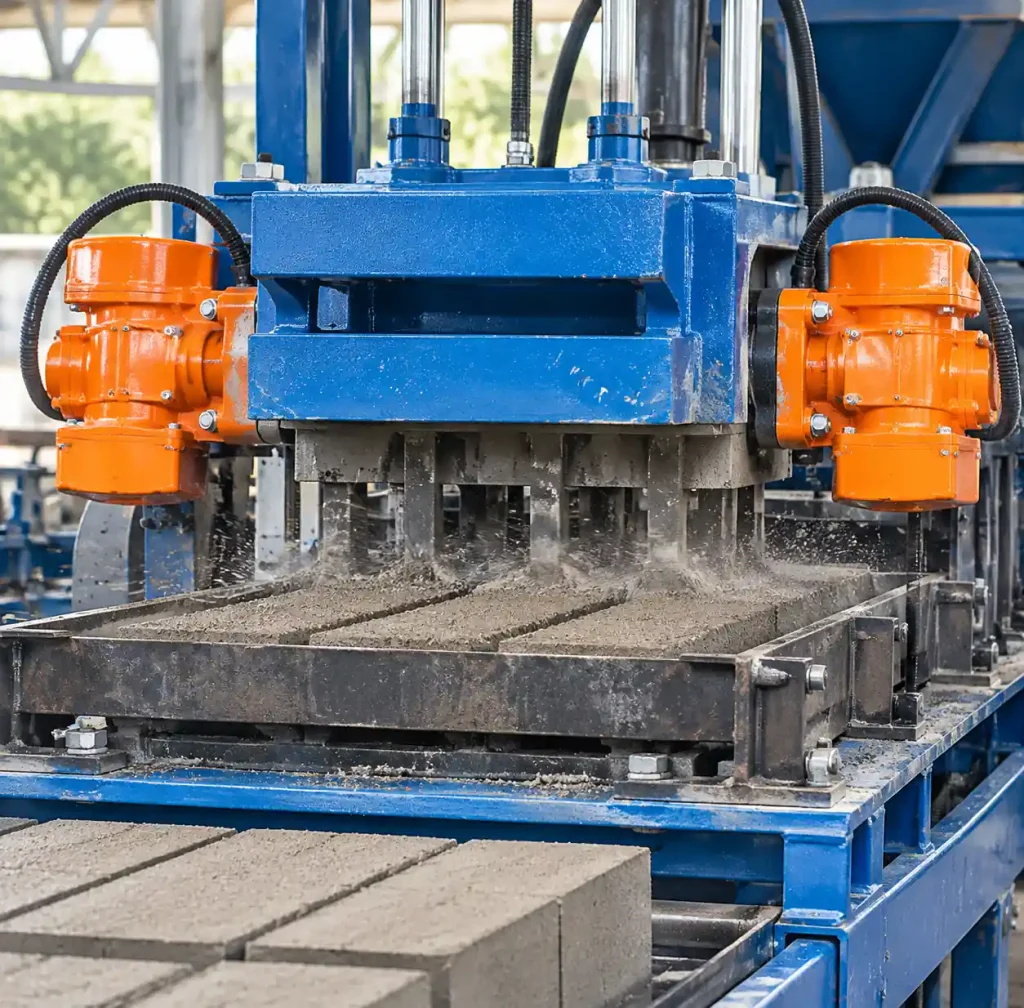
Vibration motors consume 18-25% of total machine energy, with duration directly impacting both energy use and block quality. Research on concrete block manufacturing indicates that optimizing vibration parameters can reduce energy consumption while maintaining quality standards.
Variable Frequency Vibration Control:
Installing variable frequency drives on vibration motors (3-12 kW range) enables precise vibration frequency and duration control based on block type, mix design, and real-time density monitoring. Different products require different vibration profiles—hollow blocks need 6-9 seconds while solid blocks require 9-13 seconds.
Adaptive Vibration Algorithms:
Smart control systems monitor hydraulic pressure resistance during compression to determine when concrete achieves target density, automatically terminating vibration precisely when optimal compaction occurs. This prevents over-vibration that wastes energy without improving quality while ensuring every block receives sufficient compaction.
Energy savings from optimized vibration control average 18-24% of vibration system consumption, equivalent to 3-6% of total machine energy—adding $80-180 monthly savings on mid-capacity operations.
Automated Material Handling Efficiency
Material handling systems—conveyors, elevators, and transfer equipment—represent 12-18% of total energy in fully automated operations. Automation in manufacturing can balance output with energy consumption through intelligent control strategies.
Smart Conveyor Management
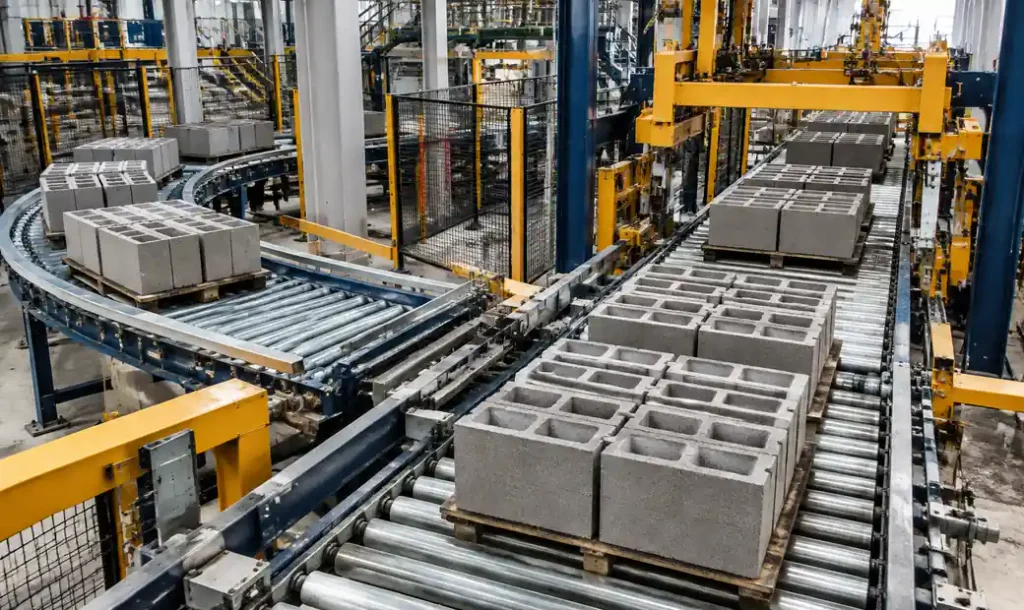
Traditional conveyor systems run continuously during production shifts regardless of actual material flow needs, wasting 30-45% of conveyor energy during production gaps and changeovers. Smart control systems synchronize conveyor operation with production cycles.
Zone-Based Conveyor Control:
Divide long conveyor systems into independently controlled zones that activate only when material approaches. Proximity sensors detect block presence and energize conveyor zones 2-3 meters ahead while de-energizing zones after blocks pass. This reduces average conveyor motor runtime by 35-50% compared to continuous operation.
Variable Speed Control:
Installing VFDs on main conveyor motors enables speed adjustment matching production rate. During full-speed production, conveyors run at 100%; during slower rates or single-block transfers, speed reduces to 60-70%, cutting energy proportionally.
Combined zone control and variable speed typically reduce conveyor energy 40-55%, yielding $120-280 monthly savings on facilities moving 20,000+ blocks daily.
Regenerative Systems
Advanced automated lines incorporate regenerative elevator systems that capture potential energy from descending loaded elevators, converting it back to electricity that offsets lifting energy. Regenerative drives can recover 25-40% of elevator energy in multi-level production layouts.
Batching and Mixing Optimization
Concrete batching and mixing systems consume 8-12% of production energy through aggregate feeding, cement dosing, water injection, and mixing action. Optimization focuses on load-based motor control and efficient mixing geometry.
Load-Adaptive Mixing Control
Planetary or pan mixers use 15-30 kW motors that traditionally run at constant speed regardless of batch size or material characteristics. Load-adaptive control systems adjust mixer motor speed based on actual torque requirements detected through current monitoring.
Implementation Results:
Testing on mid-capacity operations mixing 800-1,200 kg batches showed 12-18% mixing energy reduction through adaptive control while maintaining mix consistency. Light aggregate mixes require less mixing intensity than dense concrete, and partial batches waste energy if mixed at full-batch parameters.
High-Efficiency Mixer Designs
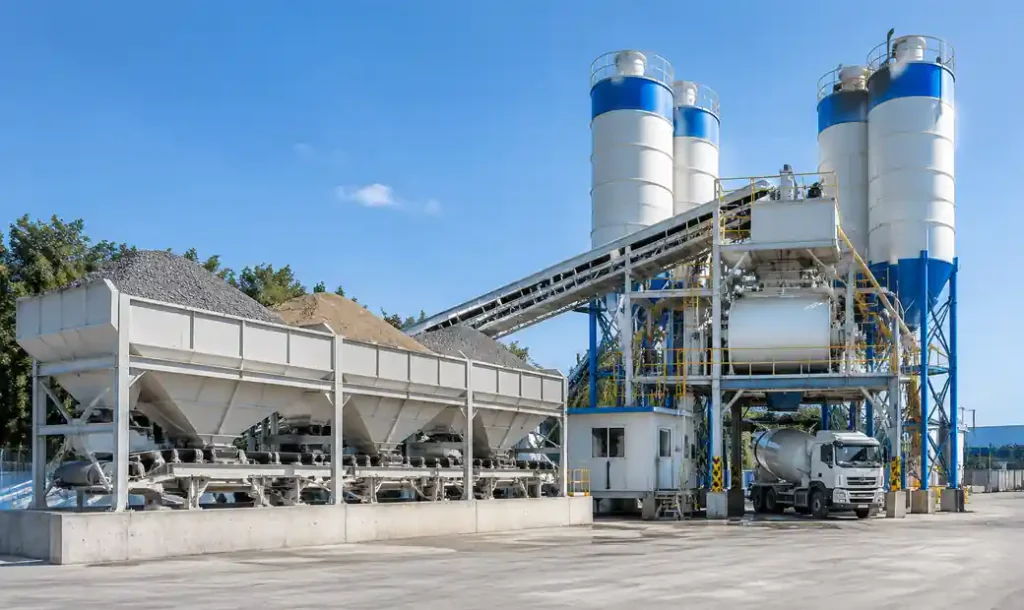
Modern intensive mixers achieve homogeneous mixing in 60-90 seconds compared to 120-180 seconds for conventional mixers, directly cutting energy consumption 40-50% per batch. The shorter cycle also increases production capacity, improving overall facility efficiency.
Twin-shaft mixers deliver particularly strong performance for block manufacturing because their counter-rotating mixing action achieves superior homogeneity with 15-25% less energy than single-shaft or pan mixers of equivalent capacity.
Supporting System Efficiency Improvements
Supporting systems including lighting, control panels, compressed air, and power quality management represent only 5-10% of consumption but offer 25-40% optimization potential with minimal investment and rapid payback.
Power Factor Correction
Electric motors operating below 0.85 power factor trigger utility surcharges of 1-3% per 0.01 below threshold. Block manufacturing facilities typically operate at 0.72-0.82 power factor without correction, incurring 3-13% energy cost penalties.
Correction Implementation:
Installing capacitor banks ($3,500-7,500 for mid-scale facilities) improves power factor to 0.95-0.98, eliminating surcharges and reducing utility demand charges 8-15%. Additional benefits include reduced electrical system heating and extended transformer life.
Monthly savings average $180-420 for facilities with $2,500-4,000 utility bills, yielding 10-18 month payback periods.
LED Lighting Conversion
Production facilities typically consume 3-8 kW on high-bay metal halide or fluorescent lighting operating 10-16 hours daily. LED conversion reduces lighting power 60-75% while improving illumination quality and eliminating lamp replacement labor.
Investment Economics:
Complete LED retrofit for a 2,000-3,000 m² production facility costs $8,000-15,000 but saves $2,400-4,800 annually, achieving payback within 2.5-4 years. Additional benefits include instant-on capability, reduced HVAC loads from lower heat generation, and 50,000+ hour lifespans eliminating maintenance disruption.
Smart Control Systems
Automated control systems that monitor real-time production status and automatically power down idle equipment prevent the 15-25% energy waste from equipment left running during breaks, changeovers, and maintenance periods.
PLC-based smart control can schedule automated startup/shutdown sequences, prevent simultaneous starting of multiple large motors that create demand spikes, and optimize production scheduling to minimize peak demand exposure.
Real-World Energy Efficiency Comparisons
Actual consumption data from comparable operations demonstrates the cumulative impact of implementing multiple efficiency technologies. The following comparison examines three 20,000 block/day facilities with different efficiency levels.
| Configuration | Hydraulic | Vibration | Material Handling | Batching/Mixing | Supporting | Total Daily | Monthly Cost | Cost per Block |
|---|---|---|---|---|---|---|---|---|
| Baseline | 280 kWh | 95 kWh | 110 kWh | 65 kWh | 50 kWh | 600 kWh | $2,160 | $0.030 |
| Mid-Efficiency | 182 kWh | 76 kWh | 66 kWh | 55 kWh | 35 kWh | 414 kWh | $1,490 | $0.021 |
| High-Efficiency | 140 kWh | 72 kWh | 55 kWh | 52 kWh | 31 kWh | 350 kWh | $1,260 | $0.018 |
| Savings vs Baseline | 50% | 24% | 50% | 20% | 38% | 42% | 42% | 40% |
The mid-efficiency facility implemented VFDs on hydraulic motors, zone-controlled conveyors, and power factor correction—investments totaling $18,000-25,000 yielding $670 monthly savings and 27-37 month payback.
The high-efficiency facility added servo-hydraulic technology, regenerative elevators, adaptive vibration control, and LED conversion—total investment $45,000-65,000 generating $900 monthly savings with 50-72 month payback but also delivering superior production flexibility and quality consistency.
Implementation Strategy for Energy Optimization
Successful energy efficiency implementation requires systematic assessment, prioritized investment, and continuous monitoring. Operations achieving 35-50% consumption reductions typically follow structured multi-phase approaches rather than attempting wholesale system replacement.
Phase 1: Assessment and Quick Wins (Months 1-2)
Begin with comprehensive energy auditing using portable power analyzers on individual system components to establish baseline consumption and identify highest-impact opportunities. Focus initial investments on quick-payback improvements.
Priority Actions:
- Power factor correction: 10-18 month payback, immediate utility cost reduction
- LED lighting conversion: 2.5-4 year payback, zero operational downside
- Eliminate idle equipment runtime: Software changes only, immediate savings
- Hydraulic pressure optimization: Testing and adjustment, minimal cost
These quick wins typically reduce consumption 8-15% within 60 days while generating cash flow to fund subsequent phases.
Phase 2: Hydraulic System Upgrade (Months 3-6)
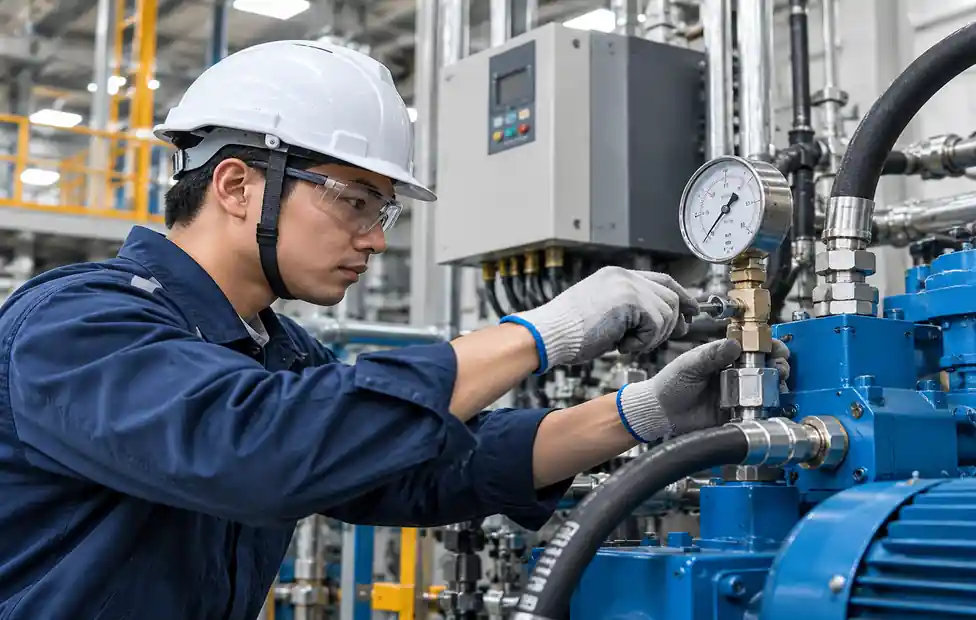
With 45-55% of energy concentrated in hydraulic systems, Phase 2 focuses on VFD installation on main hydraulic motors and optimization of hydraulic circuit design to reduce throttling losses.
Implementation Sequence:
Install VFDs on hydraulic pump motors during scheduled maintenance windows to minimize production disruption. Commission VFD programming to coordinate with PLC production control, ensuring proper acceleration/deceleration ramps and pressure maintenance during speed transitions.
Budget $3,500-6,500 per hydraulic motor system including drive, installation, and programming. Expect 12-16 month payback with 28-40% hydraulic energy reduction.
Phase 3: Automation Expansion (Months 6-12)
Phase 3 integrates smart controls across material handling, batching, and supporting systems while implementing adaptive algorithms for vibration optimization.
Key Investments:
- Zone-controlled conveyor systems with presence detection
- Load-adaptive mixing control with torque monitoring
- Variable frequency vibration control with density feedback
- Automated startup/shutdown sequencing
Combined Phase 3 investments run $15,000-28,000 delivering additional 12-20% energy reduction and improving production consistency through tighter process control.
Monitoring and Continuous Improvement
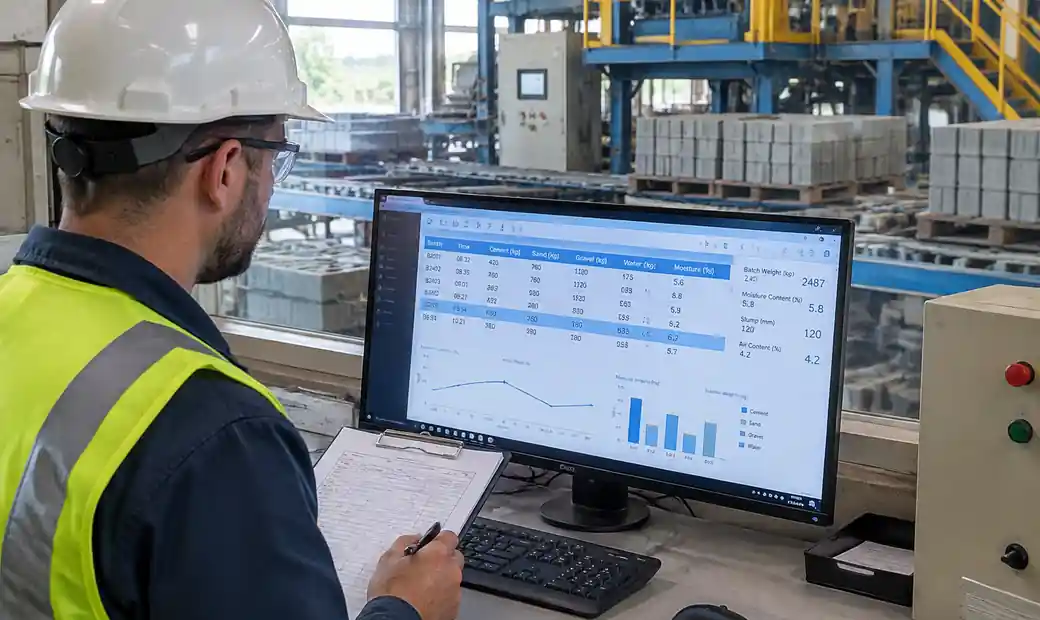
Installing permanent energy monitoring systems enables ongoing optimization and early detection of efficiency degradation from worn components or process drift. Modern IoT-based monitoring costs $4,000-8,000 for facility-wide systems providing real-time consumption by subsystem.
Establishing energy per block Key Performance Indicators (KPIs) with daily tracking allows rapid response to efficiency changes. Operations maintaining strict monitoring typically sustain 95-98% of post-optimization savings long-term versus 75-85% retention without systematic tracking.
Automation Technologies Enabling Efficiency
Modern block manufacturing automation goes beyond replacing manual labor—it enables fundamentally more efficient production through technologies impossible with manual control.
PLC-Based Production Control
Programmable Logic Controllers optimize production timing, coordinate subsystem operation, and eliminate energy-wasting delays inherent in manual operation. PLC control enables cycle time precision to 0.1 seconds, compared to 3-8 second human reaction variability.
Energy Impact:
Precise cycle control reduces average cycle time 8-15% through elimination of human hesitation and coordination delays. This seemingly minor improvement compounds across 1,000-2,500 daily cycles into substantial energy savings through increased output per kWh.
PLC systems also enable sophisticated energy management features including demand limiting (preventing utility peak demand charges), optimized startup sequencing (avoiding simultaneous motor starts), and automated idle-mode transitions during production gaps.
Sensor-Based Adaptive Control
Advanced automated systems incorporate multiple sensor technologies providing real-time feedback for continuous process optimization:
Pressure Sensors:
Monitor hydraulic pressure during compression to detect when concrete achieves target density, enabling automatic cycle termination precisely when adequate compaction occurs rather than using fixed-time compression cycles.
Vibration Monitoring:
Accelerometers on vibration tables detect density-related frequency response changes, allowing real-time vibration duration adjustment matching actual material behavior rather than predetermined timing.
Motor Current Sensing:
Continuous monitoring of motor current reveals actual load conditions, enabling load-based speed adjustment for mixers, conveyors, and hydraulic pumps.
These sensor systems add $8,000-15,000 to automation costs but enable 5-12% additional energy savings through optimization impossible with open-loop fixed-parameter control.
Remote Monitoring and IoT Integration
Cloud-connected production monitoring enables energy management across multiple production facilities and provides data for continuous optimization. IoT systems typically track 15-30 parameters including:
- Total facility power consumption
- Individual subsystem energy usage
- Production rate and energy per block
- Equipment runtime and utilization
- Power quality metrics
Data analytics identify efficiency improvement opportunities, predict maintenance needs before energy consumption degradation, and benchmark performance across facilities or shifts.
الأسئلة الشائعة
How much can energy efficiency improvements reduce operating costs in automated block manufacturing?
Comprehensive energy optimization typically reduces electrical consumption 30-50% in automated operations, equivalent to $8,000-25,000 annual savings for mid-to-large scale facilities producing 15,000-40,000 blocks daily. The exact savings depend on baseline efficiency, electricity rates, production volume, and scope of improvements implemented. Quick-win measures like power factor correction and hydraulic pressure optimization often achieve 10-15% reductions with minimal investment.
What is the typical payback period for energy efficiency upgrades in block production?
Payback periods vary significantly by technology. Quick wins like power factor correction and LED lighting pay back within 10-36 months. VFD installations on hydraulic motors typically achieve payback in 12-18 months. Comprehensive automation upgrades including servo-hydraulic systems and advanced controls require 36-60 months but deliver additional benefits beyond energy savings including improved quality consistency, reduced maintenance, and increased production flexibility.
Do energy-efficient automated systems compromise production speed or block quality?
No—properly implemented efficiency systems maintain or improve both production rate and quality. VFD-controlled hydraulic systems deliver identical compression force with lower energy input. Optimized vibration control improves quality consistency by eliminating over-vibration and under-vibration. Automation enables tighter process control than manual operation, reducing quality variation while consuming less energy through elimination of human timing inconsistency.
Which energy efficiency improvement delivers the highest ROI?
Hydraulic system optimization through VFD installation consistently delivers highest ROI because hydraulic power represents 45-55% of consumption and VFD technology is mature with predictable savings. A $4,000-6,000 VFD investment reducing hydraulic energy 35-45% typically pays back within 12-16 months. Power factor correction offers faster payback (10-18 months) but lower absolute savings because it addresses smaller consumption percentages.
Can existing manual or semi-automatic machines be retrofitted for better energy efficiency?
Yes—most energy efficiency technologies retrofit successfully to existing equipment. VFDs install on any standard AC motor, power factor correction works system-wide regardless of machine type, and LED lighting replaces existing fixtures directly. However, advanced features like adaptive vibration control and servo-hydraulic systems may prove uneconomical to retrofit versus purchasing new automated equipment. Economic analysis should compare retrofit costs against new equipment providing both automation productivity gains and integrated energy efficiency.
How does automation level affect energy efficiency in block manufacturing?
Higher automation levels consistently deliver better per-block energy efficiency despite higher absolute consumption. Manual operations consume 0.040-0.050 kWh per block, semi-automatic systems use 0.032-0.038 kWh per block, and fully automated lines achieve 0.028-0.034 kWh per block. Automation enables precise control, eliminates idle time, coordinates subsystem operation optimally, and maintains consistent process parameters impossible with human operators—all contributing to superior efficiency.
What role does production planning play in energy efficiency?
Production planning significantly impacts energy efficiency through demand management and equipment utilization optimization. Scheduling production to avoid utility peak-demand periods reduces costs 8-15% even with identical kWh consumption. Batching similar products minimizes changeover downtime when equipment remains energized but non-productive. Coordinating production across multiple machines prevents simultaneous peak loads that trigger demand charges. Facilities with sophisticated production scheduling achieve 5-10% lower energy costs than comparable operations with ad-hoc scheduling.
Are there government incentives for energy efficiency improvements in manufacturing?
Many regions offer substantial incentives for industrial energy efficiency. Programs vary by location but commonly include utility rebates (covering 15-40% of equipment costs for qualified efficiency upgrades), tax credits for energy-efficient equipment purchases, low-interest financing for efficiency projects, and accelerated depreciation on qualifying investments. Check with local utilities and industrial development agencies for specific programs—combined incentives often reduce net investment 25-50%, dramatically improving project economics.
الخلاصة
Energy efficiency in automated block manufacturing represents a major untapped profit opportunity for most operations. With electrical costs comprising 12-18% of production expenses and proven technologies capable of reducing consumption 30-50%, the economic case for systematic efficiency improvement is compelling. Implementation requires neither experimental technology nor operational disruption—VFD hydraulic control, optimized vibration systems, smart material handling, and power quality correction are mature, proven technologies delivering predictable results.
Success follows systematic assessment identifying highest-impact opportunities, phased implementation beginning with quick-payback improvements that generate cash flow for subsequent phases, and continuous monitoring maintaining long-term savings. Operations achieving superior results combine energy efficiency with automation technology—not merely to reduce labor, but to enable precise process control impossible with manual operation.
The automatic block making machines market growth to $2.4 billion by 2030 reflects broader industry recognition that modern automated systems deliver comprehensive advantages: higher output, better quality consistency, reduced labor, and dramatically lower energy consumption per block. For producers facing competitive pressure and rising energy costs, efficiency optimization has transitioned from optional enhancement to strategic necessity.
If you need high-efficiency automated block making equipment for your production operation, Raytone Block Machinery offers advanced manufacturing systems incorporating the latest energy optimization technologies. Our QT series fully automatic lines feature VFD-controlled hydraulic systems, adaptive vibration control, smart material handling, and integrated energy monitoring delivering 35-45% energy savings versus conventional systems. We have successfully equipped operations across 50+ countries with efficient, reliable production solutions backed by comprehensive technical support.
اتصل بنا اليوم for detailed energy analysis, equipment specifications, and ROI calculations tailored to your production requirements.